2020 7/24 追記
DNA配列を変化させないエピジェネティックな共有ヌクレオチド修飾は、トランスポゾンの抑制、発生時の発現調節、インプリンティングされた発現およびX染色体サイレンシングを含む多くの機能を有し(Gigante et al、2019; GreenbergおよびBourc'his、2019)、精神疾患および神経変性などの多くの細胞機能、発生および病理状態において役割を果たすことが知られている(Armstrong et al、2019; Gaine et al、2019)。40種類以上の修飾が検証されており、そのうち5-メチルシトシン(5mC)およびN6-メチルアデニン(m6A)が最も研究されている(Sood et al、2019)。オックスフォード・ナノポア・テクノロジーズ(ONT)からのロングリード・シーケンシング・プラットフォームは、deviating current signalsを評価することによって修飾ヌクレオチドのゲノムワイドな直接観察を可能にし、そのための複数のツールが開発されている(Liu et al., 2019a, b; McIntyre et al., 2019; Rand et al., 2017; Simpson et al., 2017; Stoiber et al., 2016)が、それらの性能の包括的な評価は欠落している。最近のレビューについては、Xu and Seki (2019)を参照されたい。著者らの知る限りでは、このタイプのデータに合わせた柔軟な可視化手法はない。
ヌクレオチド修飾が存在する場合の修飾頻度とヌクレオチドあたりの確率を、追加の概要表示とともに可視化するためのソフトウェアパッケージであるmethplotlibを開発した。ほとんどの仕事はメチル化について行われてきたが、本ツールを用いた可視化は、入力として使用されるヌクレオチド修飾のタイプに本質的に不可知であり、将来の仕事は、例えばヒドロキシメチル化または直接RNAシークエンシングにおける様々なRNA修飾を認識するために上流のツールを訓練するかもしれない(Garalde et al、2018; Leger et al、2019)。執筆時点では、ヌクレオチド修飾のためのコミュニティ標準フォーマットは確立されていない。現在のmethplotlibバージョンは、nanopolish(Simpsonら、2017)またはnanocompore(Legerら、2019)からのタブ分離されたファイルと互換性があり、SAM仕様に従ってMM/MPタグでエンコードされた修飾と互換性がある。APIは、他の形式のデータに対応するために簡単に拡張することができる。遺伝子やトランスクリプトのアノテーションはGTFファイルから抽出され、他のタイプのアノテーションはBED形式で追加することができる。
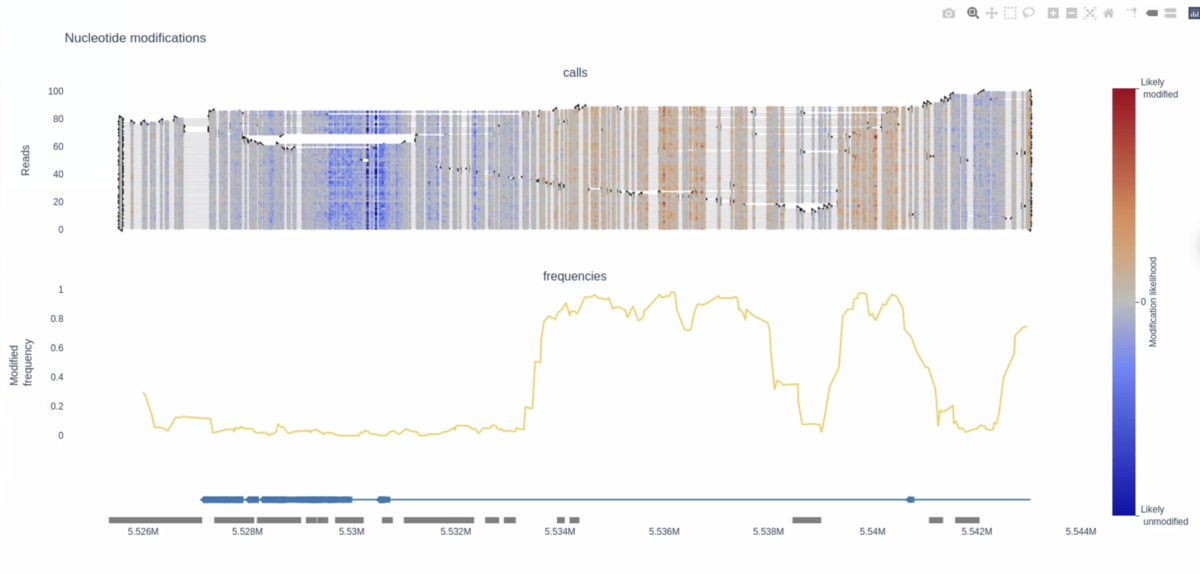
methplotlibは、Pythonのコアモジュールとnumpy(van der Walt et al、2011)、pandas(McKinney、2011)、scikit-learn(Pedregosa et al、2011)、pyranges(Stovner and Sætrom、2019)、pyfaidx(Shirleyら、2015)およびplotly(Plotly Technologies Inc. PyPIとbioconda(Grüning et al、2018)を介して簡単に利用できるようにした。ビジュアライゼーションは、デフォルトでは動的なHTML形式、またはpng、pdf、SVGなどの他の静的な出力形式で作成され、オプションで複数のサンプルについて、(i)リードの位置ごとのヌクレオチド修飾の生の尤度、(ii)位置ごとの修飾されたヌクレオチドを有する頻度、および(iii)エクソンおよび遺伝子構造を示すアノテーショントラックを示す。実施例(論文図1および補足図)は、Ensemblからの遺伝子アノテーションおよびEncodeからのDNase過敏症を用いて、ヨルバン参照個体NA19240のリンパ芽細胞株からのONT Promethlonデータのナノポリッシュコールメチル化を用いて作成された。図1の例のプロット(23 kbase locus)の生成には30秒未満かかり、1.2 MbのダイナミックHTMLプロットまたは146 Kbの静的PNGプロットを生成する。10倍以上の領域では50秒かかり、11 MbのHTMLファイルが生成される。このように、遺伝子レベルでの可視化には、リードごとの確率が最も適している。リードごとの情報を使わずに、変更の頻度だけに出力を制限すると、より高速で、より小さなファイルが得られ、より大きな領域に適している。IGV (Thorvaldsdóttir et al., 2013)やGenomeBrowseのような他のゲノムブラウザは、例えば修飾された位置の頻度をプロットするためにある程度同様の機能を提供しているが、リード当たりの確率の可視化はmethplotlibに特有の機能である。(以下略)
Our new preprint on methplotlib, visualization and analysis of @nanopore nucleotide modifications (for now mainly methylation). With @MojcaStrazisar. (Thread)https://t.co/qQFisk9NrH pic.twitter.com/ELzhJtL83u
— Wouter De Coster (@wouter_decoster) 2019年11月8日
インストール
#bioconda(link)
conda create -n methplotlib -y
conda activate methplotlib
conda install -c bioconda -y methplotlib

#pip
pip install methplotlib
> methplotlib -h
$ methplotlib -h
usage: methplotlib [-h] [-v] -m METHYLATION [METHYLATION ...] -n NAMES
[NAMES ...] -w WINDOW [-g GTF] [-b BED] [-f FASTA]
[--simplify] [--split] [--smooth SMOOTH]
[--dotsize DOTSIZE] [--example] [-o OUTFILE] [-q QCFILE]
plotting nanopolish methylation calls or frequency
optional arguments:
-h, --help show this help message and exit
-v, --version Print version and exit.
-m METHYLATION [METHYLATION ...], --methylation METHYLATION [METHYLATION ...]
methylation data in nanopolish, nanocompore or ont-
cram format
-n NAMES [NAMES ...], --names NAMES [NAMES ...]
names of datasets in --methylation
-w WINDOW, --window WINDOW
window (region) to which the visualisation has to be
restricted
-g GTF, --gtf GTF add annotation based on a gtf file matching to your
reference genome
-b BED, --bed BED add annotation based on a bed file matching to your
reference genome
required when --window is an entire chromosome, contig
or transcript
--simplify simplify annotation track to show genes rather than
transcripts
--split split, rather than overlay the methylation tracks
--smooth SMOOTH When plotting frequencies points are averaged using a
rolling window
--dotsize DOTSIZE Control the size of dots in the per read plots
--example Show example command and exit.
-o OUTFILE, --outfile OUTFILE
File to write results to. Default:
methylation_browser_{chr}_{start}_{end}.html. Use
{region} as a shorthand for {chr}_{start}_{end} in the
filename. Missing paths will be created.
-q QCFILE, --qcfile QCFILE
File to write the qc report to. Default: The path in
outfile prefixed with qc_, default is qc_report_methyl
ation_browser_{chr}_{start}_{end}.html. Use {region}
as a shorthand for {chr}_{start}_{end} in the
filename. Missing paths will be created.
テストラン
git clone https://github.com/wdecoster/methplotlib.git
cd /methplotlib/
bash examples/test.sh
以下のコマンドが実行されている。
nanopolish(wiki)やnanocomporeの分析で得られるTSVファイルを指定する。-wで描画領域を指定する。”-n"で指定しているcalls frequenciesというのはデータセットの名前。TSVファイル2つを指定しているので2つ指定している。
methplotlib -m examples/NA19240-methylation_ACTB_calls.tsv.gz examples/NA19240-methylation_ACTB_frequency.tsv.gz \
 -n calls frequencies \
 -w chr7:5,525,542-5,543,028 \
 -g examples/GRCh38-ACTB-locus.gtf.gz \
 --simplify \
 -b examples/DNase_cluster_ACTB.bed.gz
- -m methylation data in nanopolish, nanocompore or ont-cram format
- -n names of datasets in --methylation
- -w window (region) to which the visualisation has to be restricted
- -g add annotation based on a gtf file matching to your reference genome
- -b add annotation based on a bed file matching to your reference genome
- --simplify simplify annotation track to show genes rather than transcripts
methylation_browser_chr7_5525542_5543028.html

図は自由に拡大縮小、スクロールできる。
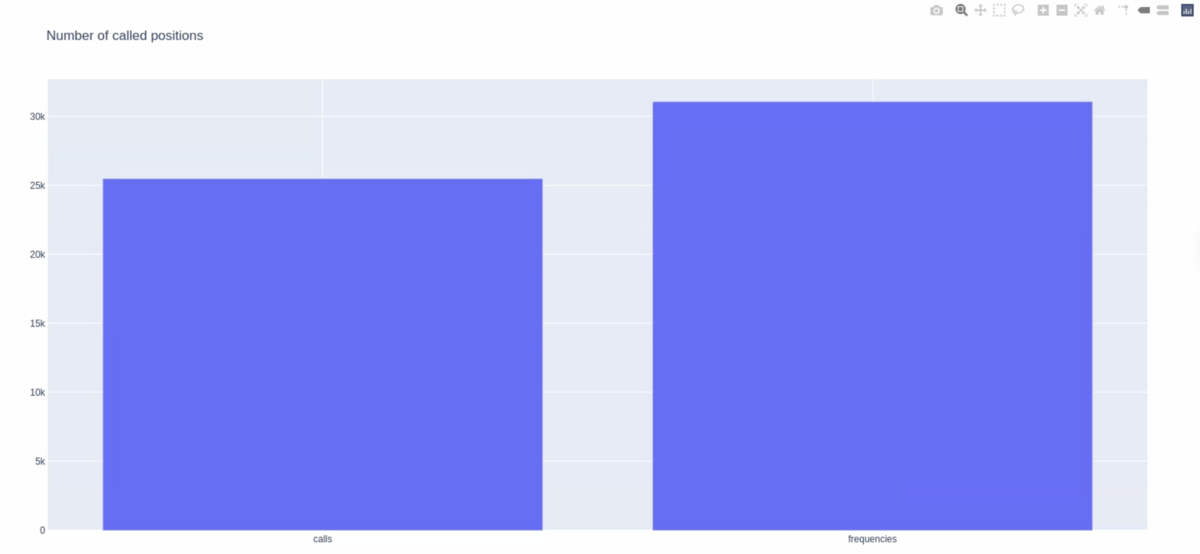
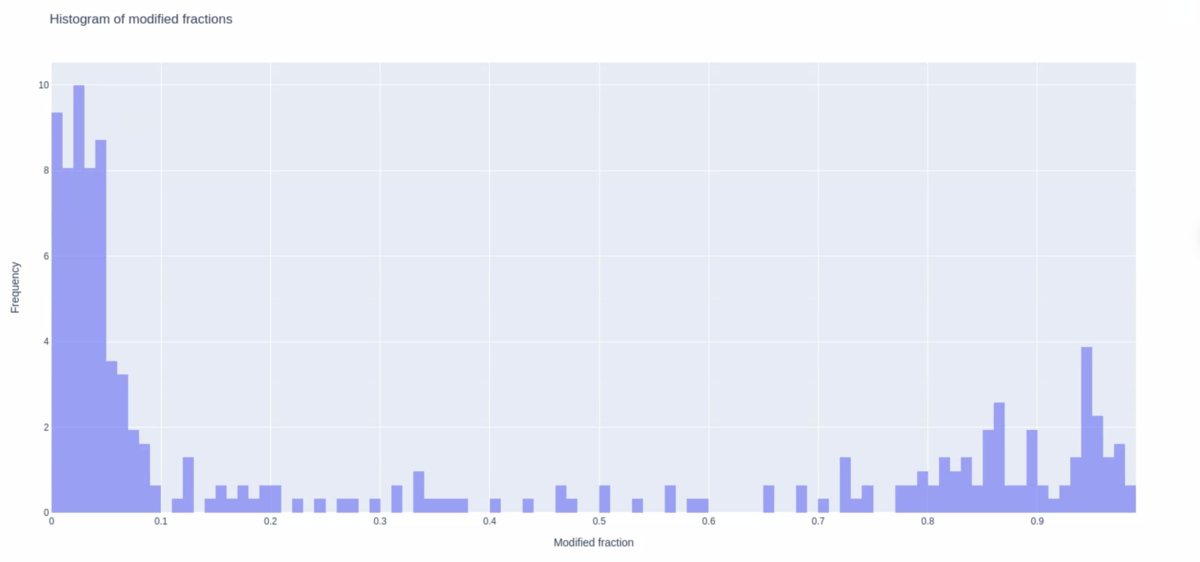
qc_report_chr7_5525542_5543028.html


実行手順
Basecallとnanopolishによるメチル化コールおよび視覚化の流れ。
#1 basecall - guppy
guppy_basecaller --flowcell FLO-MIN106 --kit SQK-LSK109 \
 -x cuda:0  -i fast5_dir -s output_dir -r

#(初回のみ)環境作成
conda create -n nanopolish -y
conda activate nanopolish
conda install -c bioconda nanopolish -y
conda install -c bioconda samtools minimap2 -y

#2 merge fastq
cat output_dir/*.fastq > ONT.fq

#3 nanopolish indexing (guppyやalbacoreの出力のsequencing_summary.txtも任意で指定して高速化できる)
nanopolish index -d fast5_dir/ -s output_dir/sequencing_summary.txt ONT.fq

#4 mapping to ref
minimap2 -t 20 -a -x map-ont ref.fa ONT.fq | samtools sort -@ 20 -T tmp -o mapped.bam
samtools index -@ 8 mapped.bam

#5 methylation call
nanopolish call-methylation -t 20 -r ONT.fq -b mapped.bam -g ref.fa -w "chr1:1-100000" > methylation_calls_chr1_1-100000.tsv

#6 visualization
methplotlib -m methylation_calls_chr1_1-100000.tsv \
 -n calls \
 -w chr1:5000-10000 \
 -g ref.gtf.gz \
 --simplify
引用
Methplotlib: analysis of modified nucleotides from nanopore sequencing
Wouter De Coster, Endre Bakken Stovner, Mojca Strazisar
Bioinformatics. 2020 May 1;36(10):3236-3238