ドットプロットは線形比較と並んでゲノム比較における基本的な可視化手法であり、構造変異、反復領域、配列の類似性の解析に広く用いられている。しかし、既存のツールは可視化の柔軟性に限界があることが多く、特に複数の配列を1つの連続した軸に連結する必要がある。この制約により、ハイライトやユーザー定義のグリッド線を効果的に適用することが難しくなり、比較ゲノム解析における解釈可能性が低下することがある。本著者らは、Matplotlibライブラリを利用し、ローカルblastn結果からカスタマイズ可能なドットプロットを生成するPython 3ベースのツールblastn2dotplotsを開発した。従来のアプローチとは異なり、blastn2dotplotsは各アラインメントを独立したサブプロットとして扱い、独立した軸のラベル付け、プロット間の間隔の調整、可視化の柔軟性の向上を可能にした。ユーザーは、特定の関心領域をハイライトしたり、カスタムグリッド線を適用したり、さまざまなゲノム解析に合わせて表示を調整することができる。このツールは、染色体構造解析、水平遺伝子移動イベントの検出、反復エレメントの可視化に特に有用で、配列比較のための直感的で適応性の高いフレームワークを提供する。
blastn2dotplotsは、既存のドットプロット可視化ツールの主要な制限に対処することで、比較ゲノム解析の明快さと柔軟性を向上させた。独立した軸制御とカスタマイズオプションを保持しながら、複数のアラインメントを別々に扱うことができるため、幅広いゲノム研究にとって貴重なリソースとなる。このツールは、配列アラインメントの正確で適応性のある可視化を必要とする研究者に斬新で効果的なソリューションを提供し、バイオインフォマティクスにおけるドットプロットの可能性を最大限に引き出す。
インストール
#環境の作成と依存ツールの導入
mamba create -n blastn2dotplots-env python=3.8 -y
conda activate blastn2dotplots-env
mamba install matplotlib=3.7.1 numpy=1.24.4 pandas=2.0.3 -y

#本体
git clone https://github.com/mokuno3430/blastn2dotplots.git
cd blastn2dotplots
chmod +x blastn2dotplot

#パスを通す
export PATH=${PWD}:$PATH
> ./blastn2dotplots -h
usage: blastn2dotplots [-h] -i1 str [-i2 str] --blastn str [--out str] [--highlight str] [--highlight_crossed str] [--min_identity int] [--min_alignlen int] [--line_width float] [--share] [--manual_grid str]
[--show_grid] [--grid_color str] [--xtitle_rotate int] [--ytitle_rotate int] [--font_size float] [--tick_label_size float] [--tick_width int] [--figure_size float float] [--hspace float]
[--wspace float] [--h_alpha float] [--left_edge float] [--right_edge float] [--top_edge float] [--bottom_edge float] [--colormap {0,1,2,3,4,5}] [-v]
optional arguments:
-h, --help show this help message and exit
-i1 str, --input1 str
sequence IDs of database at blastn (=row)
-i2 str, --input2 str
sequence IDs of query at blastn (=column)
--blastn str blastn.tsv (-outfmt '6 std qlen slen' at blastn)
--out str Optional: prefix of pdf file (default out)
--highlight str Optional: positions.tsv (scaffold start end color)
--highlight_crossed str
Optional: positions.tsv (scaffold start end color)
--min_identity int Optional: minimum sequence identity (default 90)
--min_alignlen int Optional: minimum alignment length (default 100)
--line_width float Optional: line width of dotplots (default 1.0)
--share Optional: sharing axis scales among subplots.
--manual_grid str Optional: positions.tsv (scaffold position)
--show_grid Optional: show grid-line
--grid_color str Optional: grid color (default grey)
--xtitle_rotate int Optional: (default 0)
--ytitle_rotate int Optional: (default 90)
--font_size float Optional: (default 8)
--tick_label_size float
Optional: (default 6)
--tick_width int Optional: scale width of axis (bp) (default -1 means auto)
--figure_size float float
Optional: Specify figure size as two numbers >= 3 (default: [8, 8]).
--hspace float Optional: (default -1 means auto)
--wspace float Optional: (default -1 means auto)
--h_alpha float Optional: transparency ratio of highlights (float in the range [0, 1]. default 0.3)
--left_edge float Optional: the position of the left edge of the subplots, as a fraction of the figure width (float in the range [0, 1]. default 0.15)
--right_edge float Optional: the position of the right edge of the subplots (float in the range [0, 1]. default 0.95)
--top_edge float Optional: the position of the top edge of the subplots (float in the range [0, 1]. default 0.90)
--bottom_edge float Optional: the position of the bottom edge of the subplots (float in the range [0, 1]. default 0.10)
--colormap {0,1,2,3,4,5}
Optional: colormap for identity of alignments ( 0:bone_r, 1:hot_r, 2:BuPu, 3:YlOrRd, 4:YlGnBu, 5:original) (default 5)
-v, --version show program's version number and exit
テストラン
Figure 3A: Plasmid Comparison
https://github.com/mokuno3430/blastn2dotplots/blob/main/sample_data/figure3A/runme.shを実行する。
cd blastn2dotplots/sample_data/figure3A
chmod +x runme.sh
./runme.sh
出力
figure3A.pdf
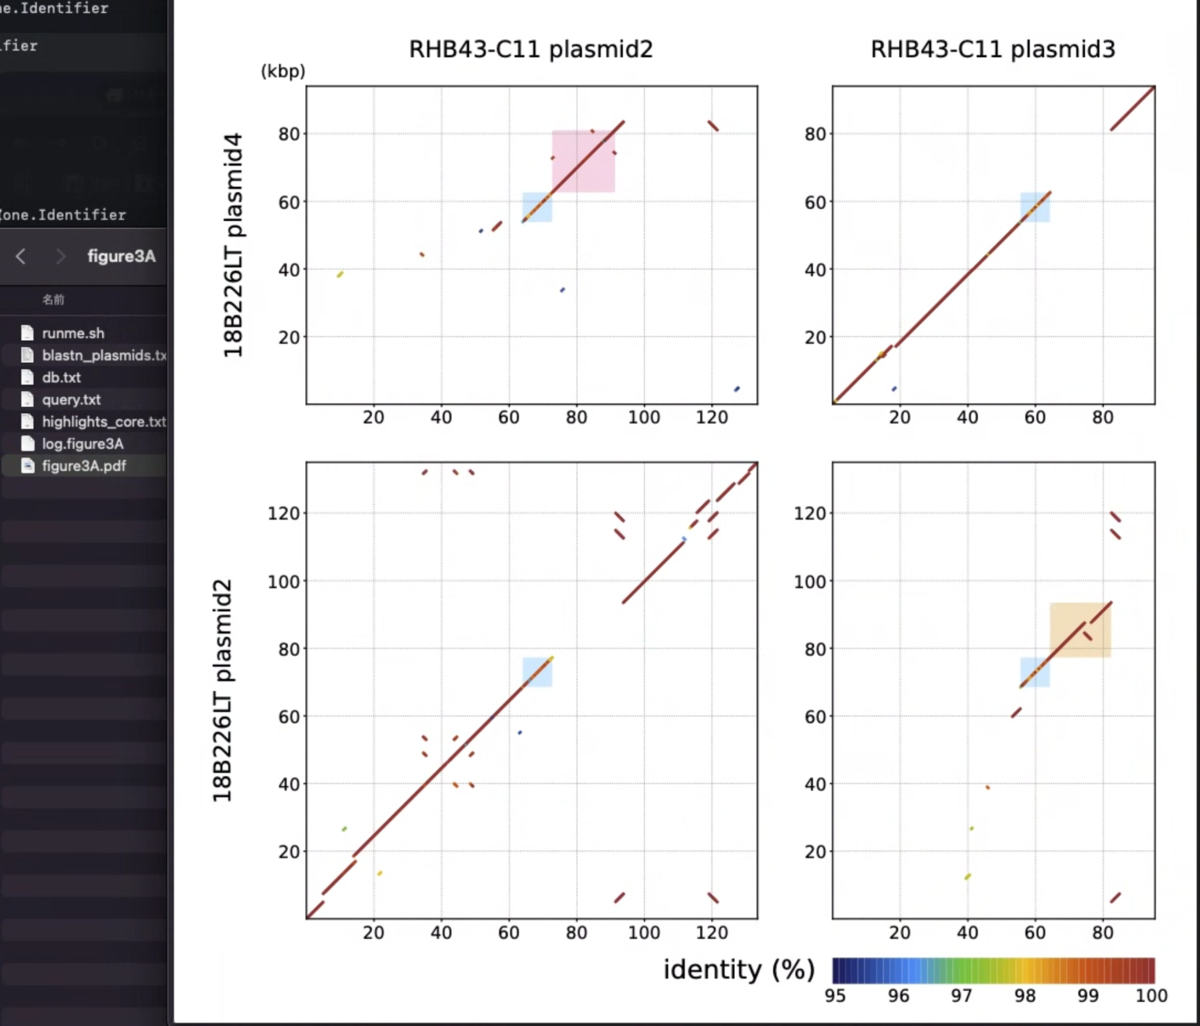
Figure 3B: nuclear mitochondrial insertion (numt) and mtDNA Comparison
https://github.com/mokuno3430/blastn2dotplots/tree/main/sample_data/figure3B
ユーザー定義のグリッド線を追加するオプションが使われている。
cd blastn2dotplots/sample_data/figure3B
chmod +x runme.sh
./runme.sh
- --manual_grid Optional: positions.tsv (scaffold position)
出力
figure3B.pdf

1,実際に使用するにはblastn比較はあらかじめユーザーが行っておく必要がある。”--outfmt 6 std qlen slen”で標準12列(std)+クエリ(qlen)とDB配列の長さ(slen)の14列タブ区切り出力を指定する。
makeblastdb -in ref.fa -dbtype nucl -out ref_db
blastn -query query.fa -db ref_db -outfmt '6 std qlen slen' -evalue 1e-10 -out blastn.out -num_threads 8
2,blastn2dotplotsをランするには、 ”--blastn”でblastn出力を指定し、さらにリファレンスとクエリの配列を”-i1”と”-i2”で指定する。これらの配列はfastaファイルではなくシーケンスIDを記載したテキストファイルとして指定する必要がある。テキストには最低限比較するシーケンスIDが必要。それだけならsamtools faidxで作るのが早い。
samtools faidx ref.fa && cut -f 1 ref.fa.fai > ref.txt
samtools faidx DB.fa && cut -f 1 DB.fa.fai > DB.txt

#あるいはレポジトリのようにblastn出力から作る
cut -f 1 blastn_outfmt6.txt | sort | uniq > query.txt
2列以上のテキストだと最大で4列:配列名、表示する配列名、スタートポジション、strandを指定する。
Column 1: Sequence ID
Column 2: Display name (optional)
Column 3: Start position (optional; shifts the origin of the axis scale)
Column 4: Orientation (optional; + or -)
3,準備が出来たらblastn2dotplots を実行する。-i1で指定した配列はy軸に、-i2で指定した配列はx軸にプロットされる。
blastn2dotplots -i1 db.txt -i2 query.txt --blastn blastn_plasmids.txt
- -i1 sequence IDs of database at blastn (=row)
- -i2 sequence IDs of query at blastn (=column)
- --blastn blastn.tsv (-outfmt '6 std qlen slen' at blastn)
”-i2”が省略された場合、自動的に”-i1”をクエリとデータベースの両方として扱い、セルフアライメントプロットが生成される。
blastn2dotplots -i1 db.txt --blastn blastn_plasmids.txt

ノイズを減らす場合、最小同一性%と最小アラインメント長を指定する。ここでは縦横のファイルサイズも大きめに指定する(15:15)。
blastn2dotplots -i1 db.txt --blastn blastn_plasmids.txt --min_identity 95 --min_alignlen 200 --figure_size 15 15
- --min_identity Optional: minimum sequence identity (default 90)
- --min_alignlen Optional: minimum alignment length (default 100)
- -figure_size Optional: Specify figure size as two numbers >= 3 (default: [8, 8]).

軸(X軸・Y軸)に表示される目盛り(tick)の間隔は--tick_widthで指定できる。
blastn2dotplots -i1 db.txt --blastn blastn_plasmids.txt --min_identity 95 --min_alignlen 200 --figure_size 15 15 --tick_width 200000
- --tick_width Optional: scale width of axis (bp) (default -1 means auto)

図の余白は --left_edgeと--right_edgeで調整できる。格子状の補助線の色は --grid_colorで指定できる。 16進のRGBで指定する。redのような原色の指定も可能。
blastn2dotplots -i1 db.txt --blastn blastn_plasmids.txt --min_identity 95 --min_alignlen 200 --figure_size 15 15 --left_edge 0.12 --right_edge 0.95 --grid_color '#00bfff'
- --left_edge Optional: the position of the left edge of the subplots, as a fraction of the figure width (float in the range [0, 1]. default 0.15)
- --right_edge Optional: the position of the right edge of the subplots (float in the range [0, 1]. default 0.95)
- --top_edge Optional: the position of the top edge of the subplots (float in the range [0, 1]. default 0.90)
- --bottom_edge Optional: the position of the bottom edge of the subplots (float in the range [0, 1]. default 0.10)
- --grid_color Optional: grid color (default grey)
その他
- --colormapでは、BLASTN のアライメントの sequence identity の色の濃淡のカラースキームを指定できる。
- 特定の領域をハイライトするには、タブ区切りのファイルを用意し、--highlight または --highlight_crossed オプションを使用する。
Column 1: Sequence ID
Column 2: Start position (0-based)
Column 3: End position
Column 4: Color code (e.g., #FF0000 for red)
- blastnに加え、Minimap2やMUMmer (nucmer)など、一般的に使用されているアライナーのアライメント結果もサポートしている。それらの出力をblastn2dotplotsが受け付けるBLASTNライクなフォーマット(-outfmt '6 std qlen slen')に変換するユーティリティスクリプトが用意されている。例:
minimap2 -c ref.fa query.fa > minimap2-output.paf
perl paf2blastn-fmt6.pl minimap2-output.paf > out_blastn-fmt6-like.txt
コメント
他にも様々なオプションがあります。helpを確認して下さい。また論文では、図1に構造バリアントの例、図4にEscherichia fergusonii のプラスミドとシロイヌナズナの2番染色体上のnumt(縦軸)とミトコンドリアDNA(横軸)の比較(上のexample)、図5にMus musculusとRattus norvegicus(の染色体間のアラインメント可視化(アラインメントには高速なMinimap2を使用)の例があります。アクセスしてみて下さい。
引用
Blastn2dotplots: multiple dot-plot visualizer for genome comparisons
Miki Okuno, Takeshi Yamamoto & Yoshitoshi Ogura
BMC Bioinformatics volume 26, Article number: 146 (2025)
関連