細菌の遺伝子機能解明は、食品生産、薬理学、生態学など様々な分野の進展を牽引している。オミクス技術が高次元の表現型データを捕捉する一方で、それらをゲノムデータと関連付けることは困難であり、細菌遺伝子の40~60%が未解明のままである。このボトルネックに対処するため、本著者らは超高速微生物ゲノムワイド関連解析(mGWAS)ソフトウェア「Scoary2」を導入する。データ探索アプリと性能向上を備えたScoary2は、mGWASを用いた大規模表現型データ解析を可能とする初のツールである。概念実証として、異なるPropionibacterium reichii株で製造されたヨーグルトの代謝物プロファイルを解析し、カルニチン代謝に影響を与える2つの遺伝子を発見した。
Home
https://github.com/MrTomRod/scoary-2/wiki
Tutorial
https://github.com/MrTomRod/scoary-2/wiki/Tutorial
Understanding the p values
https://github.com/MrTomRod/scoary-2/wiki/Understanding-the-p-values
インストール
condaで環境を作って導入した。
依存
#pip(pypi)
pip install scoary-2

#condaで環境を作って導入(gxx: #GNU C++ native compiler)
mamba create -c conda-forge -n scoary-2 python=3.10 gxx
conda activate scoary-2
pip install scoary-2
#Dcoker (Dockerhub)
docker run --rm -v /path/to/data:/data:Z \
  -u $(id -u ${USER}):$(id -g ${USER}) \
  troder/scoary-2 \
  scoary2 --help
#podman
podman run -it --rm -v $PWD:/data:Z troder/scoary-2 /bin/bash
> scoary2 --help
INFO: Showing help with the command 'scoary2 -- --help'.
NAME
scoary2 - Scoary2: Associate genes with traits!
SYNOPSIS
scoary2 GENES TRAITS OUTDIR <flags>
DESCRIPTION
Scoary2: Associate genes with traits!
POSITIONAL ARGUMENTS
GENES
Type: str
Path to gene presence/absence table: columns=isolates, rows=genes
TRAITS
Type: str
Path to trait presence/absence table: columns=traits, rows=isolates
OUTDIR
Type: str
Directory to place output files
FLAGS
--multiple_testing=MULTIPLE_TESTING
Type: str
Default: 'bonferroni:0.999'
Apply multiple testing to the p-values of Fisher's test to account for the many genes/traits tested. Format: "method:cutoff". Cutoff is a number that specifies the FWER and method is one of [native, bonferroni, sidak, holm-sidak, holm, simes-hochberg, hommel, fdr_bh, fdr_by, fdr_tsbh, fdr_tsbky]. If method is 'native': then, the cutoff targets the uncorrected p-value from Fisher's test.
--trait_wise_correction=TRAIT_WISE_CORRECTION
Type: bool
Default: False
Apply multiple testing correction to each trait separately. Not recommended as this can lead to many false positives!
-w, --worst_cutoff=WORST_CUTOFF
Type: Optional[float]
Default: None
Drop traits if no gene with "worst" p-value lower than threshold. Recommended if dataset contains multiple species
--max_genes=MAX_GENES
Type: Optional[int]
Default: None
Keep only n highest-scoring genes in Fisher's test. Recommended if dataset is big and contains multiple species; avoids waisting computational resources on traits that simply correlate with phylogeny
--gene_info=GENE_INFO
Type: Optional[str]
Default: None
Path to file that describes genes: columns=arbitrary properties, rows=genes
--trait_info=TRAIT_INFO
Type: Optional[str]
Default: None
Path to file that describes traits: columns=arbitrary properties, rows=traits
--isolate_info=ISOLATE_INFO
Type: Optional[str]
Default: None
Path to file that describes isolates: columns=arbitrary properties, rows=isolates
--newicktree=NEWICKTREE
Type: Optional[str]
Default: None
Path to a custom tree in Newick format
-p, --pairwise=PAIRWISE
Type: bool
Default: True
If False, only perform Fisher's test. If True, also perform pairwise comparisons algorithm.
--n_permut=N_PERMUT
Type: int
Default: 500
Post-hoc label-switching test: perform N permutations of the phenotype by random label switching. Low p-values suggest that the effect is not merely lineage-specific.
--restrict_to=RESTRICT_TO
Type: Optional[str]
Default: None
Comma-separated list of isolates to which to restrict this analysis
--ignore=IGNORE
Type: Optional[str]
Default: None
Comma-separated list of isolates to be ignored for this analysis
--n_cpus=N_CPUS
Type: int
Default: 1
Number of CPUs that should be used. There is overhead in multiprocessing, so if the dataset is small, use n_cpus=1
--n_cpus_binarization=N_CPUS_BINARIZATION
Type: Optional[int]
Default: None
Number of CPUs that should be used for binarization. Default: one tenth of n_cpus
--trait_data_type=TRAIT_DATA_TYPE
Type: str
Default: 'binary:,'
"<method>:<?cutoff>:<?covariance_type>:<?alternative>:<?delimiter>" How to read the traits table. Example: "gene-list:\t" for OrthoFinder N0.tsv table
--gene_data_type=GENE_DATA_TYPE
Type: str
Default: 'gene-count:,'
"<data_type>:<?delimiter>" How to read the genes table. Example: "gene-list:\t" for OrthoFinder N0.tsv table
-f, --force_binary_clustering=FORCE_BINARY_CLUSTERING
Type: bool
Default: False
Force clustering of binary data even if numeric data is available
-s, --symmetric=SYMMETRIC
Type: bool
Default: True
if True, correlated and anti-correlated traits will cluster together
-d, --distance_metric=DISTANCE_METRIC
Type: str
Default: 'jaccard'
distance metric (binary data only); See metric in https://docs.scipy.org/doc/scipy/reference/generated/scipy.spatial.distance.cdist.html
--linkage_method=LINKAGE_METHOD
Type: str
Default: 'ward'
linkage method for clustering [single, complete, average, weighted, ward, centroid, median]
-o, --optimal_ordering=OPTIMAL_ORDERING
Type: bool
Default: True
whether to use optimal ordering; See scipy.cluster.hierarchy.linkage.
-c, --corr_method=CORR_METHOD
Type: str
Default: 'pearson'
correlation method (numeric data only) [pearson, kendall, spearman]
--random_state=RANDOM_STATE
Type: Optional[int]
Default: None
Set a fixed seed for the random number generator
--limit_traits=LIMIT_TRAITS
Type: Optional[(<class ...
Default: None
Limit the analysis to traits n to m. Useful for debugging. Example: "(0, 10)"
-v, --version=VERSION
Type: bool
Default: False
Print software version of Scoary2 and exit.
NOTES
You can also use flags syntax for POSITIONAL ARGUMENTS
テストラン
git clone https://github.com/MrTomRod/scoary-2.git
cd scoary-2/data/tetracycline/
tetracycline/

ランするにはRoary(あるいはOrthoFinder形式)の結果の遺伝子存在/不在テーブルをを使う。
Gene_presence_absence.csv
https://github.com/MrTomRod/scoary-2/blob/master/data/tetracycline/Gene_presence_absence.csv

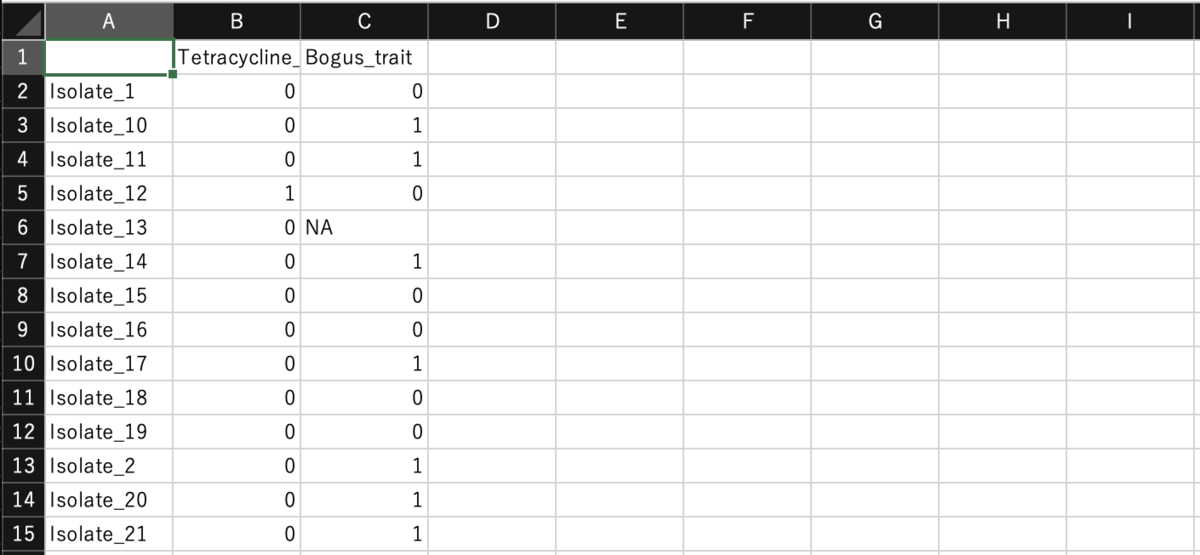
形質ファイル: そのサンプルに形質(表現型)があるかどうか。不明な場合は空行でなくNAとする。
準備ができたら実行する。Scoary 1からのTetracycline耐性に関連がある遺伝子の探索がテストデータとして提供されている。
git clone https://github.com/MrTomRod/scoary-2.git
scoary2 \
    --genes Gene_presence_absence.csv \
    --gene-data-type 'gene-count:,' \
    --traits Tetracycline_resistance.csv \
    --outdir out \
    --n-permut 1000
- --genes Path to gene presence/absence table: columns=isolates, rows=genes
- --traits Path to trait presence/absence table: columns=traits, rows=isolates
- --outdir Directory to place output files
- --gene_data_type=GENE_DATA_TYPE How to read the genes table. Example: "gene-list:\t" for OrthoFinder N0.tsv table
- --n_cpus=<N_CPUS> Number of CPUs that should be used. There is overhead in multiprocessing, so if the dataset is small, use n_cpus=1
- --n_permut=N_PERMUT Post-hoc label-switching test: perform N permutations of the phenotype by random label switching. Low p-values suggest that the effect is not merely lineage-specific.
"--gene-data-type"でオルソログ探索結果の表が数値形式かリスト形式か、セパレータが何かを指定する。上では” --gene-data-type 'gene-count:,' "としている (下のまとめ参照)。
"--n-permut"はラベルや値をランダムに入れ替えてのpost-hoc ランダム化検定(link)で、観測された効果が偶然のもの(系統特異的な見かけの関連か)を弾き、意味のある差かを検定するためにFisher's testとは別に導入されている。表現型データをN回ランダムに置換し、各置換ごとにc値とb値を計算する。これにより、無作為抽出によって遺伝子型と表現型の関連性を断ち、帰無仮説下におけるブートストラップ法による経験分布が得られる。100~1000回程度指定することが推奨されている(時間がかかる)。
出力例: Scoary2は、オリジナルのScoaryと似た結果を出力する。
out/

> cat summary.tsv
Trait best_fisher_p best_fisher_q best_empirical_p best_fq*ep
Tetracycline_resistance 1.0862106610752752e-14 1.287159633374201e-10 0.000999000999000999 1.2858737596145863e-13
フィッシャーのp値、q値と事後検定の積(fq*ep)
さらにScoary2では結果を容易に確認できる簡易データ探索アプリを内蔵して利用できるようになっている(論文より)。
https://github.com/MrTomRod/scoary-2/wiki/App#overviewhtml
#local http serverの立ち上げ
cd out/
python -m http.server --cgi 8080

overview.html

レポジトリより転載。
A) 形質のデンドログラム。青色長方形:潜在的に関連する代謝物のクラスターを強調表示
B) Scoary2で計算されたp値の負の対数。p値は高い方(左)から低い方(右)へ変化。
記号の意味:
f:フィッシャー検定によるp値
e:事後検定によるp値
*:両値の積
C) 形質名
D) 系統樹上で形質にカーソルを合わせた際に表示されるポップアップ
trait.html

A) 形質名
B) 分離株の系統樹
C) カラーバー
上段:オルソ遺伝子の存在(白)/不在(黒)
中段:二値化された形質
下段:連続形質
D) results.tsv テーブルのインタラクティブ版
E) coverage_matrix.tsv テーブルのインタラクティブ版
セル内の数値は、ゲノム内で当該アノテーションを持つ遺伝子の数を示す。
F) データセットにおけるオルソゲノムと形質の交差状況を示す円グラフ
G) 連続値のヒストグラム(各分離株がオルソゲノム(g+/g-)および形質(t+/t-)を有するか否かで色分け) レポジトリより
その他
OrthoFinderスタイルの結果と数値形式(link)の形質データの場合。
scoary2 \
 --genes N0.tsv \
 --gene-data-type 'gene-list:\t' \
 --traits traits.tsv \
 --trait-data-type 'gaussian:\t' \
 --n-permut 300 \
 --n-cpus 7 \
 --outdir out
OrthoFinderスタイルの結果と数値形式の形質データ、さらにgene-info、trait-info、isolate-info
scoary2 \
 --genes N0.tsv \
 --gene-data-type 'gene-list:\t' \
 --gene-info N0_best_names.tsv \
 --traits traits.tsv \
 --trait-data-type 'gaussian:\t' \
 --trait-info trait_info.tsv \
 --isolate-info isolate_info.tsv \
 --n-permut 200 \
 --n-cpus 7 \
 --outdir out
- --gene_info=GENE_INFO Path to file that describes genes: columns=arbitrary properties, rows=genes
- --trait_info=TRAIT_INFO Path to file that describes traits: columns=arbitrary properties, rows=traits
- --isolate_info=ISOLATE_INFO Path to file that describes isolates: columns=arbitrary properties, rows=isolates
論文より
- オリジナルのScoaryは全てのmGWASソフトウェアと同様に、単一の表現型(病原性や薬剤耐性に関連するものが多い)を分析する目的で作成されており、大量の微生物や大規模な表現型データセットを扱うようには設計されていなかった。Scoary2はオリジナルのScoaryソフトウェアを完全に書き換え拡張され大幅に高速化され、より多くの形質および分離株への適用が可能となった。
- Scoary2は連続形質の前処理(ビニング)が統合され、許容されるゲノム入力データの種類も拡大された。大規模データセットの効率的なGWAS後データ探索に不可欠な点として、Scoary2はHTML/JavaScriptで実装されたシンプルなフロントエンドを備え、データと分離株・形質・オルソ遺伝子群を記述するオプションメタデータを視覚的かつインタラクティブに統合する。これらの改良は通常のmGWAS利用ケースにおいても有益である。
-
Scoaryという名称は、その速度と使いやすさにより2015年に細菌比較ゲノム解析を変革したオルソロジー推定ソフトウェアRoaryへのオマージュとして選ばれた。しかしRoaryは現在活発な開発が行われていない。最近のQuest for Orthologsベンチマーク研究にはRoaryは含まれていない。このベンチマークによれば現在OrthoFinder が最も正確なオルソログ推定手法である [27, 28]。入力として、オリジナルの Scoary は Roary の遺伝子カウント表を使用した(各ゲノムがオルソグループごとにいくつの遺伝子を持つかを示した数値テーブル)。しかし、この方式では関心のあるオルソグループの関連遺伝子を見つけるのが煩雑だった。Scoary2は”遺伝子カウント表”との互換性を維持しつつ、RoaryとOrthoFinderの両方で生成される”遺伝子リスト表”に対応した。Scoary2では遺伝子リスト表の使用を強く推奨する(link)。この表の各セルには遺伝子識別子のリストが含まれており、データ探索アプリで遺伝子名が表示されるようになる。
引用
Scoary2: rapid association of phenotypic multi-omics data with microbial pan-genomes
Thomas Roder, Grégory Pimentel, Pascal Fuchsmann, Mireille Tena Stern, Ueli von Ah, Guy Vergères, Stephan Peischl, Ola Brynildsrud, Rémy Bruggmann & Cornelia Bär
Genome Biology volume 25, Article number: 93 (2024)
関連