2020 1/15 タイトル修正
人間の目にはデータの視覚的表現からパターンを識別する比類のない能力がある。高スループットシークエンシングからの突然変異の同定は大部分が自動化されているが、integrative genomics viewer(IGV; Robinson et al、2011)などのツールを用いた推定変異の目視による検査はクオリティを維持するのに重要な位置を占めている。しかしながら、IGVのような既存のリード視覚化ツールは、リファレンスゲノム中心のディスプレイモデルによって大きく制限されている。点突然変異は、シーケンシングデータ内のミスマッチ塩基として容易に表すことができるが、挿入、欠失、転座および逆位を含むより複雑な構造変化(SV)は、線形のリファレンスゲノム配列に対して視覚的に解析することがより困難である。より最近のツールはシーケンスデータ内の短いindelsを表すことができるが、より大きなSVを表現するのには役立たない(Edmonson et al、2011; Gymrek、2014)。
ゲノムの遠隔領域へのマッピングまたは予期しない方向へのリードペアのマッピング、またはアライメントの切断を含む、特定の特性を有するリードを強調表示することによって、SVのサポートをIGV内に表示することができる。しかし、これらの強調表示された不一致マッピングのリード全てが推定バリアントに同意するかどうか、もしあればどのバリアントであるかを特定することは困難である。さらに、IGVは、入力BAMファイルで提供されるアラインメントのクオリティに完全に依存しており、巨大なリファレンスゲノムに対して大量に生成されるため、特定のバリアントのリードサポートを最適に表すことができない。最後に、既存のビューア(TargetSeqView; Halper-Stromberg et al、2014 は注目すべき例外)は、推定SV付近のすべてのリードデータを表示してしまうので、SVをサポートするリードとリファレスのアレルをサポートするリード、SVとは関係ないリードを識別することが難しい。
これらの制限を克服するために、著者らはsvvizを提示する。これはSVに関連するリードだけをソートして表示するSVのリードビジュアライザーである。 IGVと同様に、svvizはバリアントを視覚化するだけで、バリアントを同定する訳ではない。 svvizは、標準のOS XまたはLinuxデスクトップマシン上でローカルに実行でき、入力としてリードデータ、リファレンスゲノムおよびSVを必要とする。 svvizで採用されている柔軟なアプローチにより、転座、欠失と挿入、逆位、転移因子の挿入などの任意のSVタイプを表示できる。ビジュアライゼーションは、スケーラブルなベクタグラフィックス(SVG)、つまりオープンなWeb標準グラフィックス形式でレンダリングされ、ローカルにホストされたインタラクティブなWebブラウザビューアに表示されるか、またはpublish可能な形式でエクスポートされる。 svvizは、ショートリード[Illumina(Bentley et al、2008)]のシングルエンド、ペアエンドならびにメイトペア、またロングリード[Pacific Biosciences (Eid et al., 2009), Oxford Nanopore or Illumina's synthetic long-reads]を含む任意のシーケンシングプラットフォームからのBAMフォーマットのリードデータをサポートする。バッチモードでは、複数のSVをstandard variant call format(VCF)の入力として使用可能で、1つのコマンドで数百または数千のSVの要約統計およびPDFまたはSVGの視覚化を生成できる。遺伝子モデルまたはリピートのようなアノテーション情報は、各アレルと関連させて表示できる。
マニュアル
svviz
https://svviz.readthedocs.io/en/latest/
svviz2
https://svviz2.readthedocs.io/en/latest/
svvizに関するツイート
インストール
mac10.12のpython2.7.10環境でテストした。
#version1 python2.7(エラーが出たらマニュアル参照)
pip install -U svviz

#version2 python 3.3 or greater
pip install -U git+git://github.com/nspies/svviz2.git
ここではversion1の動作を確認していく。
> svviz
$ svviz
usage: svviz [options] [demo] [ref breakpoint...] [ref vcf]
svviz version 1.6.2
positional arguments:
ref reference fasta file (a .faidx index file will be created if it doesn't exist so you need
write permissions for this directory)
breakpoints information about the breakpoint to be analyzed; see below for information
optional arguments:
-h, --help show this help message and exit
required parameters:
-b BAM, --bam BAM sorted, indexed bam file containing reads of interest to plot; can be specified multiple
times to load multiple samples
input parameters:
-t TYPE, --type TYPE event type: either del[etion], ins[ertion], inv[ersion], mei (mobile element insertion),
tra[nslocation], largedeletion (ldel), breakend (bkend) or batch (for reading variants
from a VCF file in batch mode)
-A ANNOTATIONS, --annotations ANNOTATIONS
bed or gtf file containing annotations to plot; will be compressed and indexed using
samtools tabix in place if needed (can specify multiple annotations files)
--fasta FASTA An additional indexable fasta file specifying insertion sequences (eg mobile element
sequences)
-q MAPQ, --min-mapq MAPQ
minimum mapping quality for reads (default: 0)
--pair-min-mapq PAIR_MAPQ
include only read pairs where at least one read end both exceeds PAIR_MAPQ and
falls near the variant being analyzed (default: 0)
--max-multimapping-similarity MAX_SIMILARITY
maximum ratio between best and second-best alignment scores within visualization
region in order to retain read (default: 0.95)
-a QUALITY, --aln-quality QUALITY
minimum score of the Smith-Waterman alignment against the ref or alt allele in order to be
considered (multiplied by 2)
--aln-score-delta DELTA
minimum difference in scores between ref alignment score and alt alignment score
to be assigned to one allele (use an integer to specify a hard score difference
threshold, or a float to specify a score difference relative to the read size;
default: 2)
--include-supplementary
include supplementary alignments (ie, those with the 0x800 bit set in the bam flags);
default: false
--fast implements some optimizations designed to find exact sequence matches quickly;
will substantially increase speed on Illumina data but may result in some inexact
results; default: false
--sample-reads SAMPLE_READS
use at most this many reads (pairs), sampling randomly if need be, useful
when running in batch mode (default: use all reads)
--max-reads MAX_READS
maximum number of reads allowed, totaled across all samples, useful when running in batch
mode (default: unlimited)
--max-size MAX_SIZE maximum event size allowed, totaled across all chromosome parts in bp; if either the ref
allele or alt allele exceeds this size, it will be skipped (default: unlimited)
--max-deletion-size MAX_DELETION_SIZE
deletion size above which the deletion is analyzed in breakend mode (default: don't
convert to breakend mode)
interface parameters:
-v, --version show svviz version number and exit
-p PORT, --port PORT define a port to use for the web browser (default: random port)
--processes PROCESSES
how many processes to use for read realignment (default: use all available cores)
--no-web don't show the web interface
--save-reads OUT_BAM_PATH
save relevant reads to this file (bam)
--verbose VERBOSE how verbose the progress and logging should be
-e EXPORT, --export EXPORT
export view to file; in single variant-mode, the exported file format is determined from
the filename extension unless --format is specified; in batch mode, this should be the name
of a directory into which to save the files (use --format to set format); setting --export
automatically sets --no-web
--format FORMAT file export format, either svg, png or
pdf; by default, this is pdf (batch mode) or automatically identified from the file
extension of --export
-O, --open-exported automatically open the exported file
--converter CONVERTER
which program should be used to convert the output into PDF or PNG; choose from [webkitToPDF,
librsvg, inkscape] (default: auto)
--thicker-lines Reads are shown with thicker lines, potentially overlapping one another, but increasing
contrast when zoomed out
--context CONTEXT Number of additional nucleotides of genomic context to either side of the visualization
(useful for showing nearby annotations)
-f, --flanks Show reads in regions flanking the structural variant; these reads do not
contribute to the ref or alt allele read counts (default: false)
--skip-cigar Don't color mismatches, insertions and deletions
--dotplots generate dotplots to show sequence homology within the aligned region; requires some
additional optional python libraries (scipy and PIL) and may take several minutes for
longer variants
--export-insert-sizes
plot the insert size distributions for each sample, for each event
--summary SUMMARY_FILE
save summary statistics to this (tab-delimited) file
presets:
--lenient lowers the minimum alignment quality, showing reads even when breakpoints are only
approximately correct, or reads of lower quality (eg PacBio); and requires a larger
difference in alignment scores in order to assign a read to an allele
Breakpoint formats:
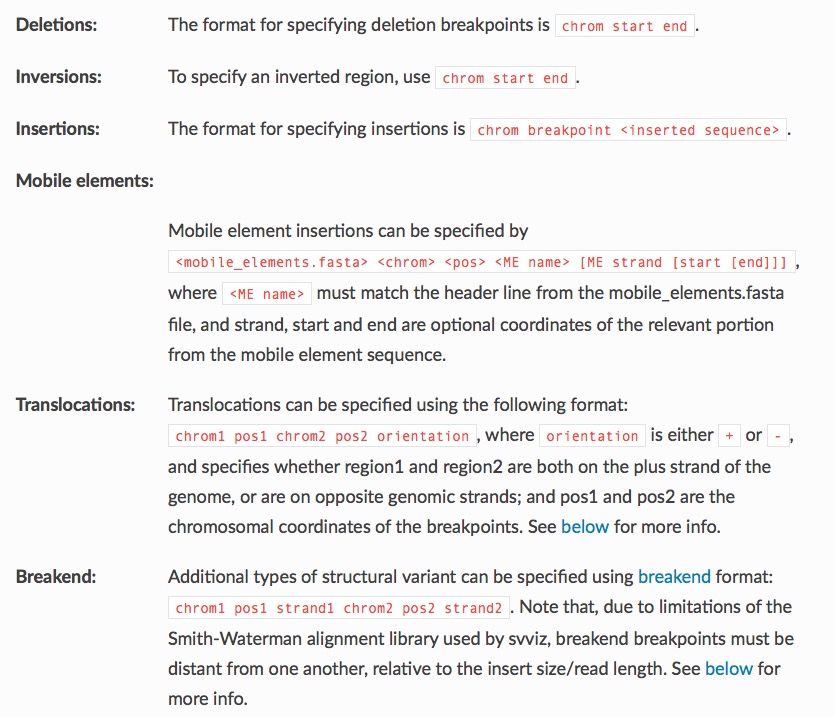
Format for deletion (-t del) breakpoints is '<chrom> <start> <end>'
Format for largedeletion (-t ldel) breakpoints is '<chrom> <start> <end>'
Format for insertion (-t ins) breakpoints is '<chrom> <pos> [end] <seq>';
specify 'end' to create a compound deletion-insertion, otherwise insertion
position is before 'pos'
Format for inversion (-t inv) breakpoints is '<chrom> <start> <end>'
Format for mobile element insertion (-t mei) is '<mobile_elements.fasta>
<chrom> <pos> <ME name> [ME strand [start [end]]]'
Format for a translocation (-t tra) is 'chrom1 start1 chrom2 start2 orientation'
Format for a breakend (-t bkend) is 'chrom1 start1 strand1 chrom2 start2 strand2'
For an example, run 'svviz demo'.
Submit bug reports and feature requests at
https://github.com/svviz/svviz/issues
テストラン
以下のコマンドを打つ。family trioのテストデータ(BAMやFASTA)がダウンロードされ、ジョブが実行される。
svviz demo
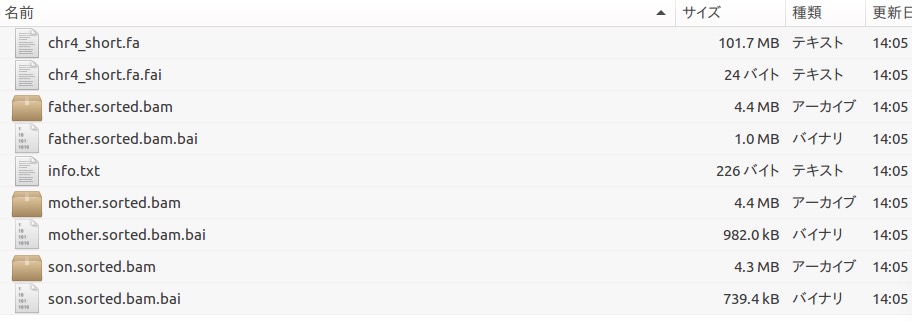
ダウンロードされたテストデータ。
ジョブが終わるとデフォルトのhmtlブラウザに結果が標準出力される。結果は “Alt”, “Ref” and “Amb”に分けて表示される。テストでは、父、母、息子のbamファイルの、inversionが起きている部位のリードを比べている。
hmtlブラウザへの出力
1、Alt: Reads aligning better to the alternate allele than the reference allele.
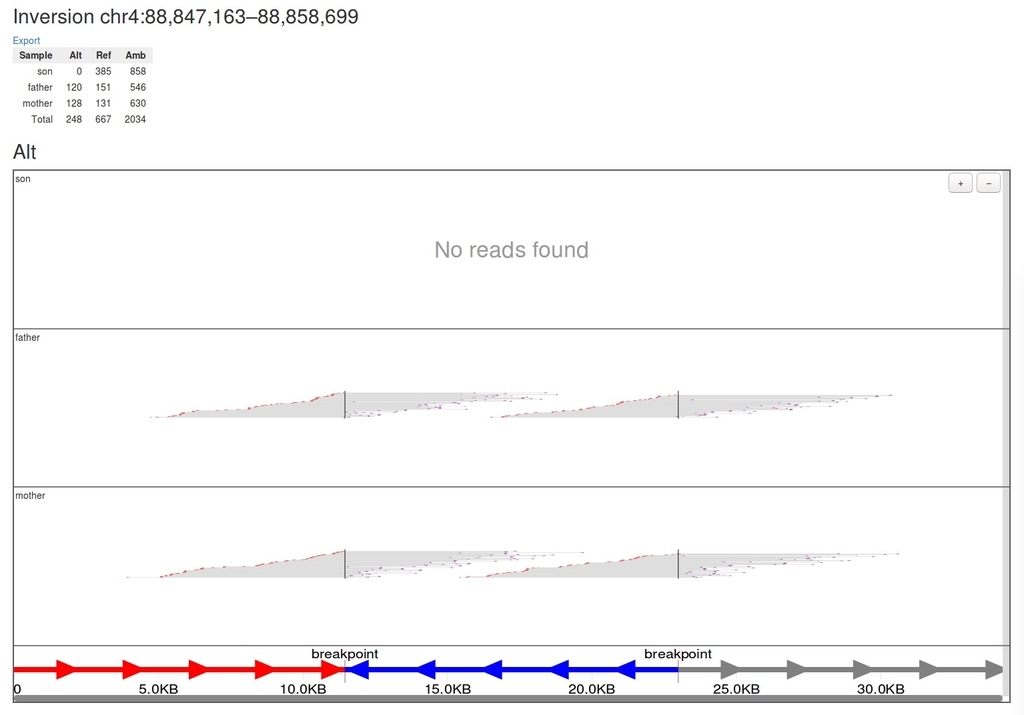
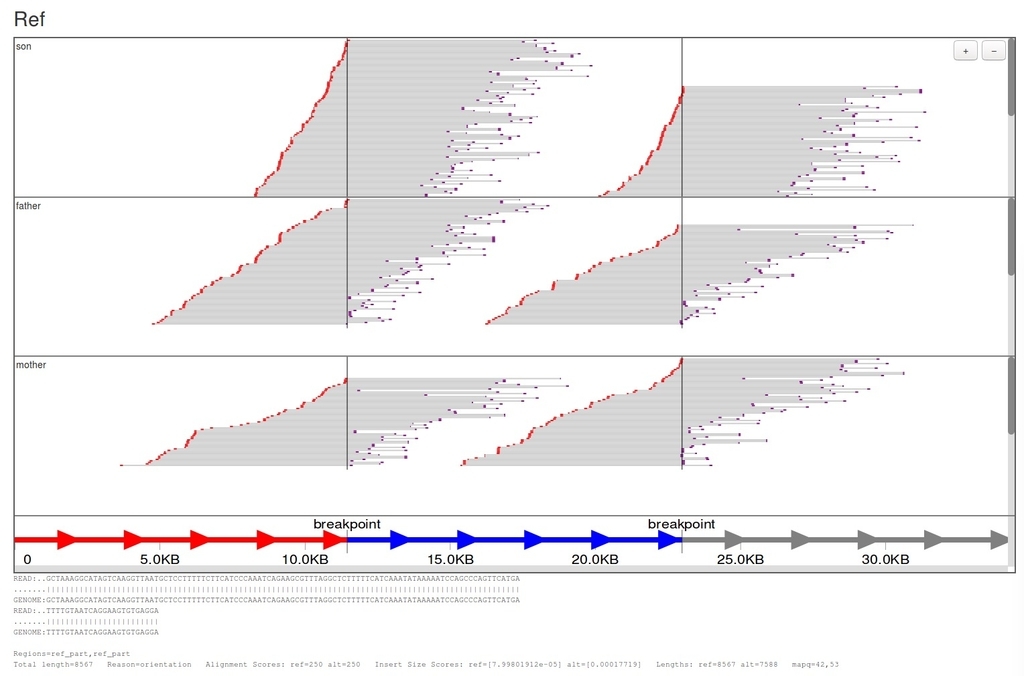
テストデータはメイトペア(7kbくらい)で、リードの左右の点がペアエンドのforward(赤)とreverse(紫)のリードを表しており、灰色はペアエンドのオーバーラップしていない領域を表している。図の下の数値は相対的なポジションをkb単位で表し、矢印は領域の向きを表している。このデモはInversion予測部位を可視化しており、そのため、Altの図だけ青の矢印が反対向きになっている。ブレイクポイントは縦線で表示されている。カラースキームはAlt、Ref、Ambで統一されているため、比較できる。矢印とカラーの具体的な使い分けはマニュアルのcomlex SVの例を見ると分かりやすい(link)。
2、Ref: Reads aligning better to the reference allele.
3、Amb: Reads that align poorly to both alleles, or equally well to both alleles, and hence do not provide evidence for or against the structural variant being analyzed. (web view only)
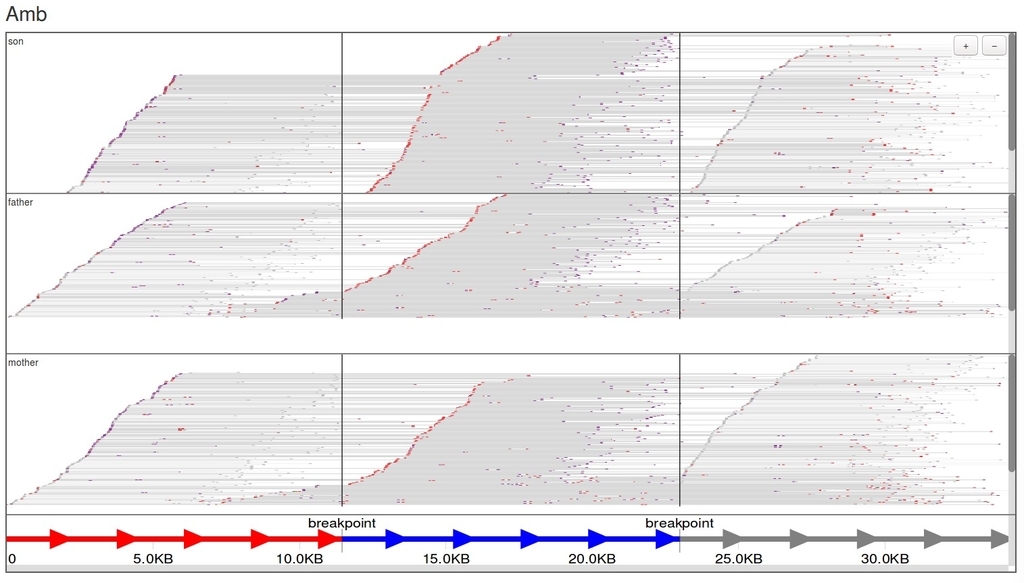
Amb: ambiguous
可視化されているリードは全てSmith-Watermanでリアライメントされている(*1)。それぞれのリードのアライメントは、リードをクリックすることで表示できる。
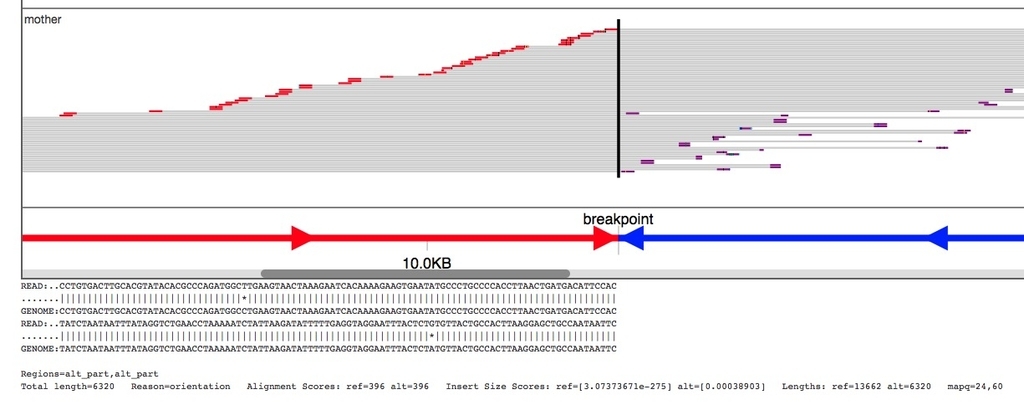
右上のボタンを押すこと拡大縮小でき、カーソルをドラッグすることで上下左右に移動もできる。まさに至れり尽くせりで、UIに目立つ不満点がないのがすごい。表示を終えるには、一般のコマンドの終了と同様、端末エミュレータをアクティブにして"ctrl + c" を押す。
実行方法
例えばsample1とsample2のbamそれぞれの、chr7の153757067-153758235の範囲の欠失に関係あるリードを可視化して調べる。
svviz -t del -b sample1.sorted.bam -b sample2.sorted.bam hg19.fasta chr7 153757067 153758235
現在は以下のタイプのSVの可視化がサポートされている。
Command line interface — svviz 1.6.2 documentation
VCFでコールされた部位をまとめて可視化するにはbatch modeを使う。
svviz --type batch --format svg --export output_dir \
 --summary events_summary.tsv \
 -b sample1.sorted.bam \
 hg19.fasta \
 events.vcf
-
--summary save summary statistics to this (tab-delimited) file
-
-b sorted, indexed bam file containing reads of interest to plot; can be specified multiple times to load multiple samples
-
--format file export format, either svg, png or pdf; by default, this is pdf (batch mode) or automatically
-
--export export view to file; in single variant-mode, the exported file
まとめのTSVファイルが出力され、さらに指定ディレクトリに1コールずつ可視化されたSVGファイルが出力される。
svvizはSmith-Watermanアルゴリムでアライメントし直すため、CPUをあるだけ使いますが、たくさんのリードが関係してくる巨大なSVの場合、1部位の可視化でもそれなりの時間を要します。いきなり巨大なVCFを使ってランすると終わりません。様子を見て使って下さい。
オプションを見る限り、工夫次第である程度高速化はできそうです。
引用
svviz: a read viewer for validating structural variants
Spies N, Zook JM, Salit M, Sidow A
Bioinformatics. 2015 Dec 15;31(24):3994-6
*1
SIMD Smith-Waterman C/C++/Python/Java Library が使われている。
https://github.com/mengyao/Complete-Striped-Smith-Waterman-Library/
類似ツール
