クロマチンの発現、タンパク質-DNA/RNA相互作用、アクセス性、構造などが条件や細胞種によってどのように異なるかを同時に可視化することにより、オルタナティブスプライシングの制御機構や機能的影響について理解を深めることができる。しかし、既存のSashimiプロット作成ツールは、柔軟性に欠け、複雑で、複数のバイオインフォマティクスフォーマットや様々なゲノミクスアッセイからのデータソースを統合するには使い勝手が悪いままである。そのため、より拡張性のある可視化ツールが必要とされている。ここでは、プログラマブルでインタラクティブなWebベースのアプローチにより、出版品質の可視化を生成するPythonパッケージであるsashimi.pyを紹介する。Sashimi.pyは、シングルセルRNA-seq、タンパク質-DNA/RNA相互作用、ロングリードシーケンスデータ、Hi-Cデータなどの多種多様なデータソースのゲノムデータを前処理なしで視覚的に解釈するプラットフォームで、主要ジャーナルの要求を満たす出力ファイルのフォーマットにも幅広い柔軟性を備えている。Sashimi.pyパッケージは、Bioconda (https://anaconda.org/bioconda/sashimi-py), Docker, PyPI (https://pypi.org/project/sashimi.py/), GitHub (https://github.com/ygidtu/sashimi.py) で自由に利用できるオープンソースソフトウェアであり、ローカル展開用の組み込みWebサーバーも提供されている。
Features of sashimi.py(Githubより)
- Support various file formats as input
- Support strand-aware coverage plot
- Visualize coverage by heatmap, including HiC diagram
- Visualize protein domain based the given gene id
- Demultiplex the single-cell RNA/ATAC-seq which used cell barcode into cell population
- Support visualizing individual full-length reads in read-by-read style
- Support visualize circRNA sequencing data
インストール
mambaでpython3.10の環境を作ってテストした(ubuntu18使用)。
#conda(bioconda)
mmaba create -n sashimi
conda activate sashimi
mamba install -c conda-froge -c bioconda sashimi-py -y

#pip(pypi)
pip install sashimi.py

#docker(dockerhub)
docker pull ygidtu/sashimi
docker run --rm ygidtu/sashimi --help

#installing local web server
git clone https://github.com/ygidtu/sashimi.py sashimi
cd sashimi/web
# build the frontend static files
npm install -g vue-cli vite && npm install
vite build

# prepare the backend server
pip install fastapi pydantic jinja2 uvicorn
python server.py --help
> sashimipy -h
Usage: sashimipy [OPTIONS]
Try 'sashimipy -h' for help.
Error: Missing option '-e' / '--event'.
(sasami) kazu@kazu:~$ sashimipy -h
Usage: sashimipy [OPTIONS]
Welcome to use sashimi
Options:
--version Show the version and exit.
--debug enable debug level log
-e, --event TEXT Event range eg: chr1:100-200:+ [required]
Common input files configuration:
--color-factor INTEGER RANGE Index of column with color levels (1-based);
NOTE: LUAD|red -> LUAD while be labeled in
plots and red while be the fill color
[default: 1; x>=1]
--barcode PATH Path to barcode list file, At list two
columns were required, - 1st The name of bam
file;- 2nd the barcode;- 3rd The group
label, optional;- 4th The color of each
cell type, default using the color of
corresponding bam file.
--barcode-tag TEXT The default cell barcode tag label
[default: CB]
--umi-tag TEXT The default UMI barcode tag label [default:
UB]
-p, --process INTEGER RANGE How many cpu to use [1<=x<=128]
--group-by-cell Group by cell types in density/line plot
--remove-duplicate-umi Drop duplicated UMIs by barcode
Output settings:
-o, --output PATH Path to output graph file
-d, --dpi INTEGER RANGE The resolution of output file [default:
300; x>=1]
--raster The would convert heatmap and site plot to
raster image (speed up rendering and produce
smaller files), only affects pdf, svg and PS
--height FLOAT The height of output file, default adjust
image height by content [default: 1]
--width INTEGER RANGE The width of output file, default adjust
image width by content [default: 10; x>=0]
--backend TEXT Recommended backend [default: Agg]
Reference settings:
-r, --reference PATH Path to gtf file, both transcript and exon
tags are necessary
--interval PATH Path to list of interval files in bed
format, 1st column is path to file, 2nd
column is the label [optional]
--show-id Whether show gene id or gene name
--show-exon-id Whether show gene id or gene name
--no-gene Do not show gene id next to transcript id
--domain Add domain information into reference track
--proxy TEXT The http or https proxy for EBI/Uniprot
requests,if `--domain` is True, eg:
--timeout INTEGER RANGE The requests timeout when `--domain` is
True. [default: 10; x>=1]
--local-domain TEXT Load local domain folder and load into
reference track, download from https://hgdow
nload.soe.ucsc.edu/gbdb/hg38/uniprot/
--remove-empty Whether to plot empty transcript
--transcripts-to-show TEXT Which transcript to show, transcript name or
id in gtf file, eg: transcript1,transcript2
--choose-primary Whether choose primary transcript to plot.
--ref-color TEXT The color of exons [default: black]
--intron-scale FLOAT The scale of intron [default: 0.5]
--exon-scale FLOAT The scale of exon [default: 1]
Density plot settings:
--density PATH The path to list of input files, a tab
separated text file, - 1st column is path
to input file, - 2nd column is the file
category, - 3rd column is input file alias
(optional), - 4th column is color of input
files (optional), - 5th column is the
library of input file (optional, only
required by bam file).
--customized-junction TEXT Path to junction table column name needs to
be bam name or bam alias.
--only-customized-junction Only used customized junctions.
-t, --threshold INTEGER RANGE
Threshold to filter low abundance junctions
[default: 0; x>=0]
--density-by-strand Whether to draw density plot by strand
--show-site Whether to draw additional site plot
--site-strand [all|+|-] Which strand kept for site plot, default use
all [default: all]
--included-junctions TEXT The junction id for including, chr1:1-100
--show-junction-num Whether to show the number of junctions
--sc-density-height-ratio FLOAT
The relative height of single cell density
plots [default: 1]
Line plot settings:
--line PATH The path to list of input files, a tab
separated text file, - 1st column is path
to input file, - 2nd column is the file
category, - 3rd column is input file group
(optional), - 4th column is input file
alias (optional), - 5th column is color
platte of corresponding group (optional).
--hide-legend Whether to hide legend
--legend-position TEXT The legend position
--legend-ncol INTEGER RANGE The number of columns of legend [x>=0]
Heatmap plot settings:
--heatmap PATH The path to list of input files, a tab
separated text file, - 1st column is path
to input file, - 2nd column is the file
category, - 3rd column is input file group
(optional), - 4th column is color platte
of corresponding group.
--clustering Enable clustering of the heatmap
--clustering-method [single|complete|average|weighted|centroid|median|ward]
The clustering method for heatmap [default:
ward]
--distance-metric
[braycurtis|canberra|chebyshev|cityblock|correlation|cosine|dice|euclidean|hamming|jaccard|jensenshannon|kulsinski|kulczynski1|mahalanobis|matching|minkowski|rogerstanimoto|russellrao|seuclidean|sokalmichener|sokalsneath|sqeuclidean|yule]
The distance metric for heatmap [default:
euclidean]
--heatmap-scale Do scale on heatmap matrix.
--heatmap-vmin INTEGER Minimum value to anchor the colormap,
otherwise they are inferred from the data.
--heatmap-vmax INTEGER Maximum value to anchor the colormap,
otherwise they are inferred from the data.
--show-row-names Show row names of heatmap
--sc-heatmap-height-ratio FLOAT
The relative height of single cell heatmap
plots [default: 0.2]
IGV settings:
--igv PATH The path to list of input files, a tab
separated text file, - 1st column is path
to input file, - 2nd column is the file
category, - 3rd column is input file alias
(optional), - 4th column is color of input
files (optional) - 5th column is exon_id
for sorting the reads (optional).
--m6a TEXT Sashimi.py will load location information
from the given tags and then highlight
the RNA m6a modification cite at individual
reads. If there are multiple m6a
modification site, please add tag as follow,
234423,234450
--polya TEXT Sashimi.py will load length of poly(A) from
the given tags and then visualize the
poly(A) part at end of each individual
reads.
--rs TEXT Sashimi.py will load real strand information
of each reads from the given tags and the
strand information is necessary for
visualizing poly(A) part.
--del-ratio-ignore FLOAT RANGE
Ignore the deletion gap in nanopore or
pacbio reads. if a deletion region was
smaller than (alignment length) *
(del_ratio_ignore), then the deletion gap
will be filled. currently the
del_ratio_ignore was 1.0. [0.0<=x<=1.0]
HiC settings:
--hic PATH The path to list of input files, a tab
separated text file, - 1st column is path
to input file, - 2nd column is the file
category, - 3rd column is input file alias
(optional), - 4th column is color of input
files (optional) - 5th column is data
transform for HiC matrix, eg log1p, log2,
log10 (optional).
Additional annotation:
-f, --genome PATH Path to genome fasta
--sites TEXT Where to plot additional indicator lines,
comma separated int
--stroke TEXT The stroke regions:
start1-end1:start2-end2@color-label, draw a
stroke line at bottom, default color is red
--link TEXT The link: start1-end1:start2-end2@color,
draw a link between two site at bottom,
default color is blue
--focus TEXT The highlight regions: 100-200:300-400
Motif settings:
--motif PATH The path to customized bedGraph file, first
three columns is chrom, start and end site,
the following 4 columns is the weight of
ATCG.
--motif-region TEXT The region of motif to plot in start-end
format
--motif-width FLOAT The width of ATCG characters [default: 0.8]
Layout settings:
--n-y-ticks INTEGER RANGE The number of ticks of y-axis [x>=0]
--distance-ratio FLOAT distance between transcript label and
transcript line [default: 0.1]
--reference-scale FLOAT The size of reference plot in final plot
[default: 0.25]
--stroke-scale FLOAT The size of stroke plot in final image
[default: 0.25]
Overall settings:
--font-size INTEGER RANGE The font size of x, y-axis and so on [x>=1]
--reverse-minus Whether to reverse strand of bam/reference
file
--hide-y-label Whether hide y-axis label
--same-y Whether different sashimi/line plots shared
same y-axis boundaries
--log [0|2|10|zscore] y axis log transformed, 0 -> not log
transform; 2 -> log2; 10 -> log10
--title TEXT Title
--font TEXT Fonts
-h, --help Show this message and exit.
テストラン
sashimipyはBAM、Bed、bigBed、bigWig、Depth file generated by samtools depth
、naive Hi-C formatをサポートしている。Githubでは利用可能な大半のオプションをつけてランした例が掲載されている。
git clone https://github.com/ygidtu/sashimi.py sashimi
cd sashimi/
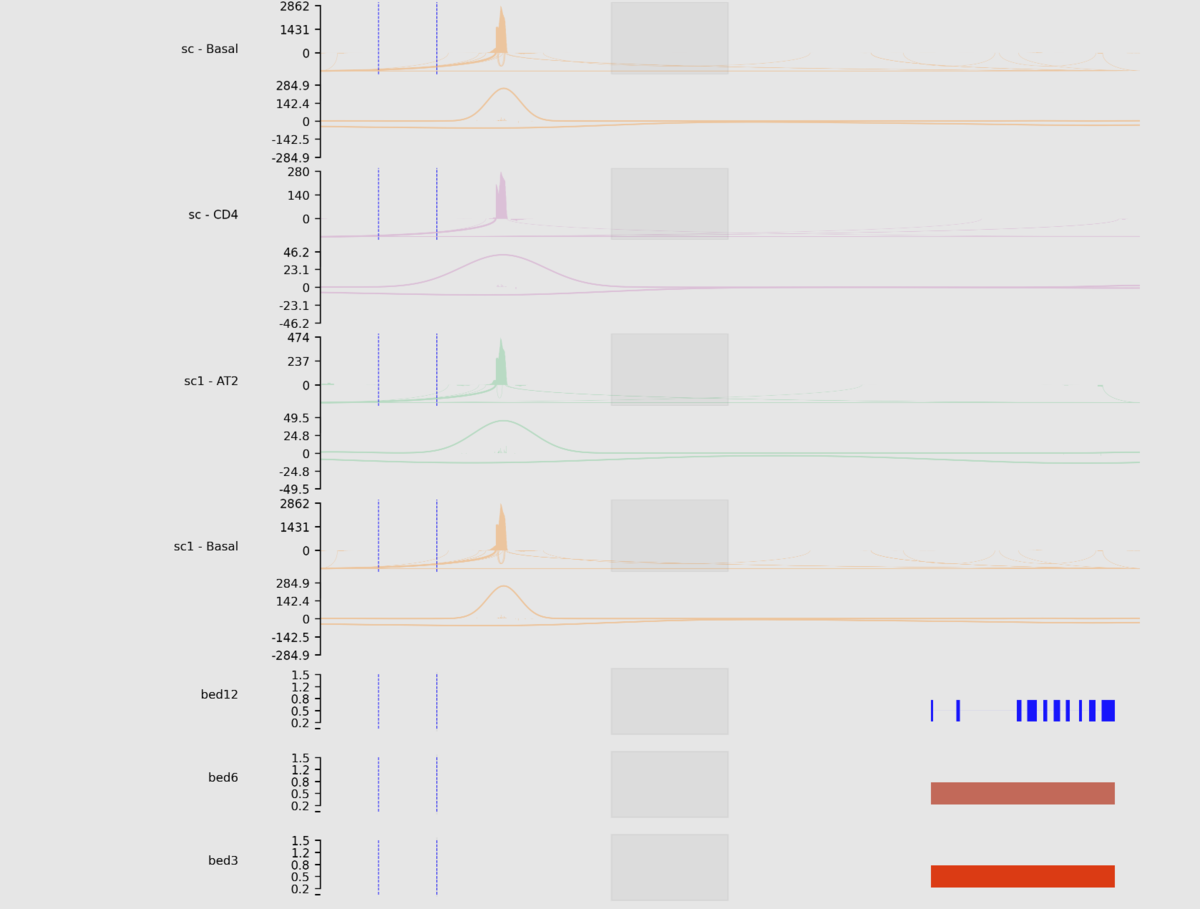
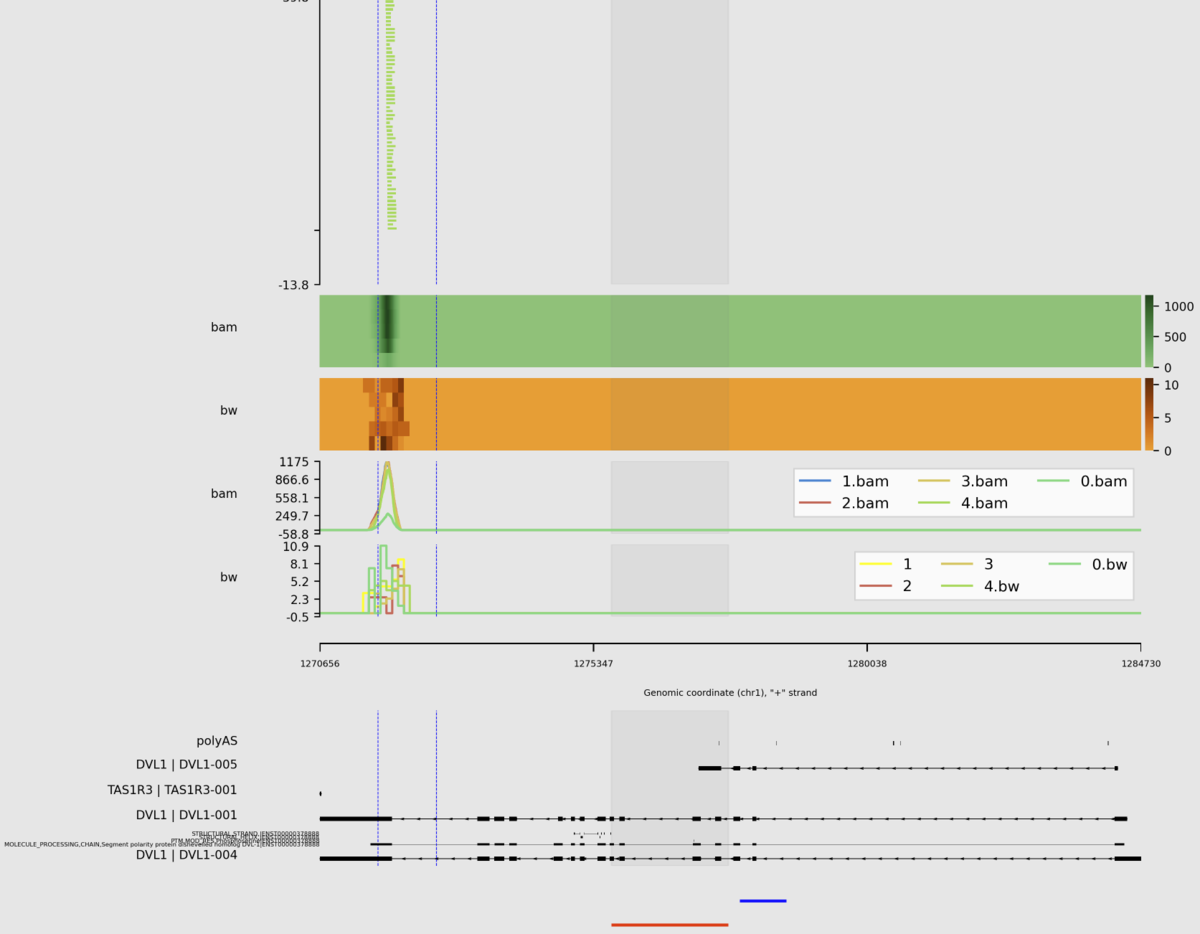
python main.py \
  -e chr1:1270656-1284730:+ \
  -r example/example.sorted.gtf.gz \
  --interval example/interval_list.tsv \
  --density example/density_list.tsv \
  --show-site \
  --igv example/igv.tsv \
  --heatmap example/heatmap_list.tsv \
  --focus 1272656-1272656:1275656-1277656 \
  --stroke 1275656-1277656:1277856-1278656@blue \
  --sites 1271656,1271656,1272656 \
  --line example/line_list.tsv \
  -o example/example.png \
  --dpi 300 \
  --width 10 \
  --height 1 \
  --barcode example/barcode_list.tsv \
  --domain --remove-duplicate-umi
出力


(縦長の画像なので分割して載せています)
引用
Sashimi.py: a flexible toolkit for combinatorial analysis of genomic data
Yiming Zhang, View ORCID ProfileRan Zhou, Yuan Wang
Posted November 03, 2022
参考
What is sashimi_plot?
https://miso.readthedocs.io/en/fastmiso/sashimi.html