Trinityに付属するスクリプトPtRは、生物学的複製が十分に相関していることを確認し、またサンプル間の関係を調査するためのユーティリティツールである。Trinityのabundance_estimates_to_matrix.plなどを使って得た発現量の行列ファイルを使う。Trinityのマニュアルに習い、使い方を確認しておく。
インストール
ubuntu18.04でtrinityの仮想環境を作ってテストした。Rのバージョンは4.1.1。
依存
- R
mamba create -n trinity python=3.8
conda activate trinity
mamba install -c bioconda -y trinity
> PtR
####################################################################################
#
#######################
# Inputs and Outputs: #
#######################
#
# --matrix <string> matrix.RAW.normalized.FPKM
#
# Optional:
#
# Sample groupings:
#
# --samples <string> tab-delimited text file indicating biological replicate relationships.
# ex.
# cond_A cond_A_rep1
# cond_A cond_A_rep2
# cond_B cond_B_rep1
# cond_B cond_B_rep2
#
# --gene_factors <string> tab-delimited file containing gene-to-factor relationships.
# ex.
# liver_enriched <tab> gene1
# heart_enriched <tab> gene2
# ...
# (use of this data in plotting is noted for corresponding plotting options)
#
#
# --output <string> prefix for output file (default: "${matrix_file}.heatmap")
#
# --save save R session (as .RData file)
# --no_reuse do not reuse any existing .RData file on initial loading
#
#####################
# Plotting Actions #
#####################
#
# --compare_replicates provide scatter, MA, QQ, and correlation plots to compare replicates.
#
#
#
# --barplot_sum_counts generate a barplot that sums frag counts per replicate across all samples.
#
# --boxplot_log2_dist <float> generate a boxplot showing the log2 dist of counts where counts >= min fpkm
#
# --sample_cor_matrix generate a sample correlation matrix plot
# --sample_cor_scale_limits <string> ex. "-0.2,0.6"
# --sample_cor_sum_gene_factor_expr <factor=string> instead of plotting the correlation value, plot the sum of expr according to gene factor
# requires --gene_factors
#
# --sample_cor_subset_matrix <string> plot the sample correlation matrix, but create a disjoint set for rows,cols.
# The subset of the samples to provide as the columns is provided as parameter.
#
# --gene_cor_matrix generate a gene-level correlation matrix plot
#
# --indiv_gene_cor <string> generate a correlation matrix and heatmaps for '--top_cor_gene_count' to specified genes (comma-delimited list)
# --top_cor_gene_count <int> (requires '--indiv_gene_cor with gene identifier specified')
# --min_gene_cor_val <float> (requires '--indiv_gene_cor with gene identifier specified')
#
# --heatmap genes vs. samples heatmap plot
# --heatmap_scale_limits "<int,int>" cap scale intensity to low,high (ie. "-5,5")
# --heatmap_colorscheme <string> default is 'purple,black,yellow'
# a popular alternative is 'green,black,red'
# Specify a two-color gradient like so: "black,yellow".
#
# # sample (column) labeling order
# --lexical_column_ordering order samples by column name lexical order.
# --specified_column_ordering <string> comma-delimited list of column names (must match matrix exactly!)
# --order_columns_by_samples_file order the columns in the heatmap according to replicate name ordering in the samples file.
#
# # gene (row) labeling order
# --order_by_gene_factor order the genes by their factor (given --gene_factors)
#
# --gene_heatmaps <string> generate heatmaps for just one or more specified genes
# Requires a comma-delimited list of gene identifiers.
# Plots one heatmap containing all specified genes, then separate heatmaps for each gene.
# if --gene_factors set, will include factor annotations as color panel.
# else if --prin_comp set, will include include principal component color panel.
#
# --prin_comp <int> generate principal components, include <int> top components in heatmap
# --add_prin_comp_heatmaps <int> draw heatmaps for the top <int> features at each end of the prin. comp. axis.
# (requires '--prin_comp')
# --add_top_loadings_pc_heatmap <int> draw a heatmap containing the <int> top feature loadings across all PCs.
# --R_prin_comp_method <string> options: princomp, prcomp (default: prcomp)
#
# --mean_vs_sd expression variability plot. (highlight specific genes by category via --gene_factors )
#
# --var_vs_count_hist <vartype=string> create histogram of counts of samples having feature expressed within a given expression bin.
# vartype can be any of 'sd|var|cv|fano'
# --count_hist_num_bins <int> number of bins to distribute counts in the histogram (default: 10)
# --count_hist_max_expr <float> maximum value for the expression histogram (default: max(data))
# --count_hist_convert_percentages convert the histogram counts to percentage values.
#
#
# --per_gene_plots plot each gene as a separate expression plot (barplot or lineplot)
# --per_gene_plot_width <float> default: 2.5
# --per_gene_plot_height <float> default: 2.5
# --per_gene_plots_per_row <int> default: 1
# --per_gene_plots_per_col <int> default: 2
# --per_gene_plots_incl_vioplot include violin plots to show distribution of rep vals
#
########################################################
# Data Filtering, in order of operation below: #########################################################
#
#
## Column filters:
#
# --restrict_samples <string> comma-delimited list of samples to restrict to (comma-delim list)
#
# --top_rows <int> only include the top number of rows in the matrix, as ordered.
#
# --min_colSums <float> min number of fragments, default: 0
#
# --min_expressed_genes <int> minimum number of genes (rows) for a column (replicate) having at least '--min_gene_expr_val'
# --min_gene_expr_val <float> a gene must be at least this value expressed across all samples. (default: 1)
#
#
## Row Filters:
#
# --min_rowSums <float> min number of fragments, default: 0
#
# --gene_grep <string> grep on string to restrict to genes
#
# --min_across_ALL_samples_gene_expr_val <int> a gene must have this minimum expression value across ALL samples to be retained.
#
# --min_across_ANY_samples_gene_expr_val <int> a gene must have at least this expression value across ANY single sample to be retained.
#
# --min_gene_prevalence <int> gene must be found expressed in at least this number of columns
# --min_gene_expr_val <float> a gene must be at least this value expressed across all samples. (default: 1)
#
# --minValAltNA <float> minimum cell value after above transformations, otherwise convert to NA
#
# --top_genes <int> use only the top number of most highly expressed transcripts
#
# --top_variable_genes <int> Restrict to the those genes with highest coeff. of variability across samples (use median of replicates)
#
# --var_gene_method <string> method for ranking top variable genes ( 'coeffvar|anova', default: 'anova' )
# --anova_maxFDR <float> if anova chose, require FDR value <= anova_maxFDR (default: 0.05)
# or
# --anova_maxP <float> if set, over-rides anova_maxQ (default, off, uses --anova_maxQ)
#
# --top_variable_via_stdev_and_mean_expr perform filtering based on the stdev vs. mean expression plot.
# Requires both: (note, if you used --log2 and/or --Zscale, settings below should use those transformed values)
# --min_stdev_expr <float> minimum standard deviation in expression
# --min_mean_expr <float> minimum mean expression value
#
######################################
# Data transformations: #
######################################
#
# --CPM convert to counts per million (uses sum of totals before filtering)
# --CPK convert to counts per thousand
#
# --binary all values > 0 are set to 1. All values < 0 are set to zero.
#
# --log2
#
# --center_rows subtract row mean from each data point. (only used under '--heatmap' )
#
# --Zscale_rows Z-scale the values across the rows (genes)
#
#########################
# Clustering methods: #
#########################
#
# --gene_dist <string> Setting used for --heatmap (samples vs. genes)
# Options: euclidean, gene_cor
# maximum, manhattan, canberra, binary, minkowski
# (default: 'euclidean') Note: if using 'gene_cor', set method using '--gene_cor' below.
#
#
# --sample_dist <string> Setting used for --heatmap (samples vs. genes)
# Options: euclidean, sample_cor
# maximum, manhattan, canberra, binary, minkowski
# (default: 'euclidean') Note: if using 'sample_cor', set method using '--sample_cor' below.
#
#
# --gene_clust <string> ward, single, complete, average, mcquitty, median, centroid, none (default: complete)
# --sample_clust <string> ward, single, complete, average, mcquitty, median, centroid, none (default: complete)
#
# --gene_cor <string> Options: pearson, spearman (default: pearson)
# --sample_cor <string> Options: pearson, spearman (default: pearson)
#
####################
# Image settings: #
####################
#
#
# --imgfmt <string> image type (pdf,svg) with default: pdf
#
# --img_width <int> image width
# --img_height <int> image height
#
################
# Misc. params #
################
#
# --write_intermediate_data_tables writes out the data table after each transformation.
#
# --show_pipeline_flowchart describe order of events and exit.
#
####################################################################################
実行方法
1、昨日紹介した方法で発現行列のファイルを得る。
2、PtRのラン
PtRのランには、サンプルとの関係を示したリストファイルが必要。そのファイルを"--samples <list>"で指定する。PtRはリストファイルからサンプルのreplicatesを判断してRNAseqのデータを比較する。
リストファイルは、サンプルグループ名<tab>反復名のタブ区切りファイル。
cond_A cond_A_rep1
cond_A cond_A_rep2
cond_B cond_B_rep1
cond_B cond_B_rep2
このリストファイルを指定する。replicates比較なら”--compare_replicates”を付ける。Count Per Milion (CPM) に変換してから比較するなら”--CPM”を付ける。log2で比較するなら ”--log2”を付ける。
/PtR --matrix counts.matrix --samples list --log2 --CPM \
--min_rowSums 10 --compare_replicates --barplot_sum_counts
- --compare_replicates provide scatter, MA, QQ, and correlation plots to compare replicates.
- --CPM convert to counts per million (uses sum of totals before filtering)
- --min_rowSums min number of fragments, default: 0
出力例
group_A.rep_compare.pdf(同じ条件のreplicates間での比較)

注;ここでは複製ではないサンプルを使用
salmon.gene.counts.matrix.barplot_sum_counts.pdf
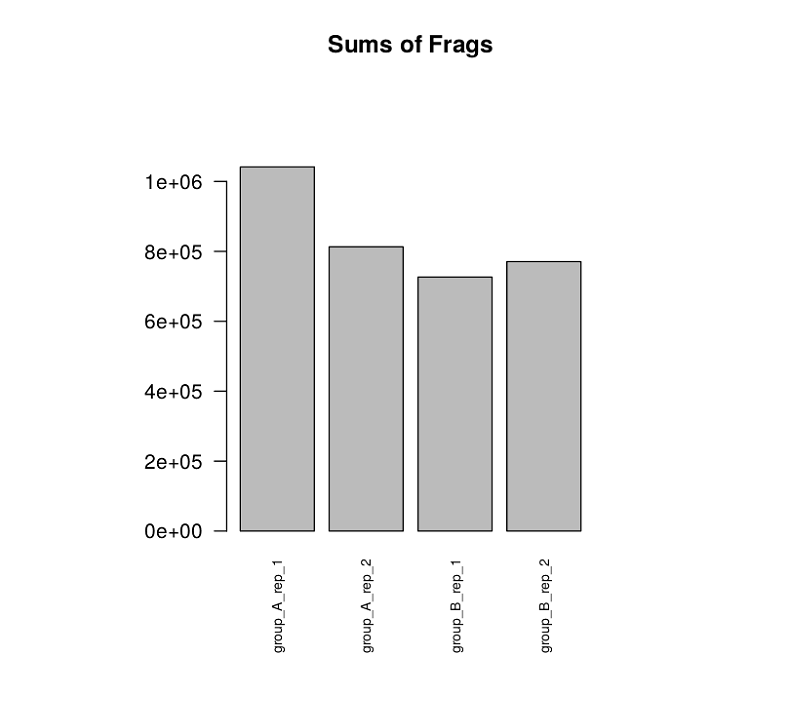
( "--barplot_sum_counts”を付けたときに出力される全サンプルのバープロット)
続いて全サンプルを比較するために相関行列のヒートマップを出力。”--compare_replicates”を外し、”--sample_cor_matrix”を指定する。
PtR --matrix counts.matrix --samples list --log2 --CPM \
--min_rowSums 10 --sample_cor_matrix
- --sample_cor_matrix generate a sample correlation matrix plot
全サンプルのペアワイズ相関行列のヒートマップが出力される。
複製間の関係を探るため主成分分析 (PCA) を行う。
PtR --matrix counts.matrix --samples list --log2 --CPM \
--min_rowSums 10 --center_rows --prin_comp 3
- --prin_comp <int> generate principal components, include <int> top components in heatmap
他にもヒートマップを描く”--heatmap”などがあります。オプションを確認して下さい。
引用
De novo transcript sequence reconstruction from RNA-seq using the Trinity platform for reference generation and analysis
Brian J Haas, Alexie Papanicolaou, Moran Yassour, Manfred Grabherr, Philip D Blood, Joshua Bowden, Matthew Brian Couger, David Eccles, Bo Li, Matthias Lieber, Matthew D MacManes, Michael Ott, Joshua Orvis, Nathalie Pochet, Francesco Strozzi, Nathan Weeks, Rick Westerman, Thomas William, Colin N Dewey, Robert Henschel, Richard D LeDuc, Nir Friedman , Aviv Regev
Nat Protoc. 2013 Aug;8(8):1494-512