Enrichrは哺乳類の遺伝子セットエンリッチメント解析ツールで、転写制御、パスウェイ、GOやヒトの表現型のオントロジー、薬剤で処理した細胞からのシグネチャーなどが収録されている(wiki)。GSEApyはEnrichrのPythonラッパーで、コマンドラインやPython上でDEGsを調査することができる。
Documentation
https://gseapy.readthedocs.io/en/latest/introduction.html
A Protocol to Prepare files for GSEApy
https://gseapy.readthedocs.io/en/latest/gseapy_tutorial.html
Frequently Asked Questions - Use custom defined GMT file input in Jupyter ?
Frequently Asked Questions — GSEApy 0.10.6 documentation
インストール
依存
- Python 3+
#conda (bioconda)
mamba create -n gseapy -y
conda activate gseapy
mamba install -c bioconda gseapy -y

#or use pip(pypi)
$ pip install gseapy
> gseapy -h
usage: gseapy [-h] [--version]
{gsea,prerank,ssgsea,replot,enrichr,biomart} ...
gseapy -- Gene Set Enrichment Analysis in Python
positional arguments:
{gsea,prerank,ssgsea,replot,enrichr,biomart}
gsea Main GSEApy Function: run GSEApy instead of GSEA.
prerank Run GSEApy Prerank tool on preranked gene list.
ssgsea Run Single Sample GSEA.
replot Reproduce GSEA desktop output figures.
enrichr Using Enrichr API to perform GO analysis.
biomart Using BioMart API to convert gene ids.
optional arguments:
-h, --help show this help message and exit
--version show program's version number and exit
For command line options of each command, type: gseapy COMMAND -h
> gseapy gsea -h
usage: gseapy gsea [-h] -d DATA -c CLS -g GMT [-t perType] [-o] [-f]
[--fs width height] [--graph int] [--no-plot] [-v]
[-n nperm] [--min-size int] [--max-size int] [-w float]
[-m] [-a] [-s] [-p procs]
optional arguments:
-h, --help show this help message and exit
Input files arguments:
-d DATA, --data DATA Input gene expression dataset file in txt format.Same
with GSEA.
-c CLS, --cls CLS Input class vector (phenotype) file in CLS format.
Same with GSEA.
-g GMT, --gmt GMT Gene set database in GMT format. Same with GSEA.
-t perType, --permu-type perType
Permutation type. Same with GSEA, choose from
{'gene_set', 'phenotype'}
Output arguments:
-o , --outdir The GSEApy output directory. Default: the current
working directory
-f , --format File extensions supported by Matplotlib active
backend, choose from {'pdf', 'png', 'jpeg','ps',
'eps','svg'}. Default: 'pdf'.
--fs width height, --figsize width height
The figsize keyword argument need two parameters to
define. Default: (6.5, 6)
--graph int Numbers of top graphs produced. Default: 20
--no-plot Speed up computing by suppressing the plot output.This
is useful only if data are interested. Default: False.
-v, --verbose Increase output verbosity, print out progress of your
job
GSEA advanced arguments:
-n nperm, --permu-num nperm
Number of random permutations. For calculating
esnulls. Default: 1000
--min-size int Min size of input genes presented in Gene Sets.
Default: 15
--max-size int Max size of input genes presented in Gene Sets.
Default: 500
-w float, --weight float
Weighted_score of rank_metrics. For weighting input
genes. Choose from {0, 1, 1.5, 2}. Default: 1
-m , --method Methods to calculate correlations of ranking metrics.
Choose from {'signal_to_noise', 'abs_signal_to_noise',
't_test', 'ratio_of_classes',
'diff_of_classes','log2_ratio_of_classes'}. Default:
'log2_ratio_of_classes'
-a, --ascending Rank metric sorting order. If the -a flag was chosen,
then ascending equals to True. Default: False.
-s , --seed Number of random seed. Default: None
-p procs, --threads procs
Number of Processes you are going to use. Default: 1
> gseapy ssgsea -h
> gseapy ssgsea -h
usage: gseapy ssgsea [-h] -d DATA -g GMT [-o] [-f] [--fs width height]
[--graph int] [--no-plot] [-v] [--sn normalize] [--ns]
[-n nperm] [--min-size int] [--max-size int] [-w weight]
[-a] [-s] [-p procs]
optional arguments:
-h, --help show this help message and exit
Input files arguments:
-d DATA, --data DATA Input gene expression dataset file in txt format. Same
with GSEA.
-g GMT, --gmt GMT Gene set database in GMT format. Same with GSEA.
Output arguments:
-o , --outdir The GSEApy output directory. Default: the current
working directory
-f , --format File extensions supported by Matplotlib active
backend, choose from {'pdf', 'png', 'jpeg','ps',
'eps','svg'}. Default: 'pdf'.
--fs width height, --figsize width height
The figsize keyword argument need two parameters to
define. Default: (6.5, 6)
--graph int Numbers of top graphs produced. Default: 20
--no-plot Speed up computing by suppressing the plot output.This
is useful only if data are interested. Default: False.
-v, --verbose Increase output verbosity, print out progress of your
job
Single Sample GSEA advanced arguments:
--sn normalize, --sample-norm normalize
Sample normalization method. Choose from {'rank',
'log', 'log_rank','custom'}. Default: rank
--ns, --no-scale If the flag was set, don't normalize the enrichment
scores by number of genes.
-n nperm, --permu-num nperm
Number of random permutations. For calculating
esnulls. Default: 0
--min-size int Min size of input genes presented in Gene Sets.
Default: 15
--max-size int Max size of input genes presented in Gene Sets.
Default: 2000
-w weight, --weight weight
Weighted_score of rank_metrics. For weighting input
genes. Default: 0.25
-a, --ascending Rank metric sorting order. If the -a flag was chosen,
then ascending equals to True. Default: False.
-s , --seed Number of random seed. Default: None
-p procs, --threads procs
Number of Processes you are going to use. Default: 1
> gseapy replot -h
usage: gseapy replot [-h] -i GSEA_dir [-o] [-f] [--fs width height]
[--graph int] [--no-plot] [-v] [-w float]
optional arguments:
-h, --help show this help message and exit
Input arguments:
-i GSEA_dir, --indir GSEA_dir
The GSEA desktop results directroy that you want to
reproduce the figure
-o , --outdir The GSEApy output directory. Default: the current
working directory
-f , --format File extensions supported by Matplotlib active
backend, choose from {'pdf', 'png', 'jpeg','ps',
'eps','svg'}. Default: 'pdf'.
--fs width height, --figsize width height
The figsize keyword argument need two parameters to
define. Default: (6.5, 6)
--graph int Numbers of top graphs produced. Default: 20
--no-plot Speed up computing by suppressing the plot output.This
is useful only if data are interested. Default: False.
-v, --verbose Increase output verbosity, print out progress of your
job
-w float, --weight float
Weighted_score of rank_metrics. Please Use the same
value in GSEA. Choose from (0, 1, 1.5, 2),default: 1
実行方法
実行するにはいくつかのファイルが必要。
必要なファイル1 - 発現データセット (Expression dataset)
発現行列として、タブ区切りテキストファイル(.gct)が必要(フォーマットの詳細)。
demoデータ:GSEApy/testSet_rand1200.gct at master · zqfang/GSEApy · GitHub

(.GCTはマイクロアレイの時代から使われているフィーマット)
拡大した。
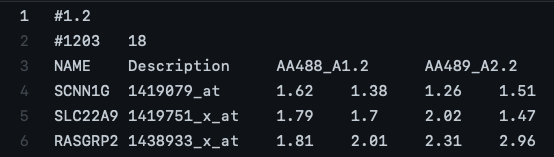
1行目はバージョン文字列。#1.2とする。
2行目には、ファイルの残りの部分に含まれるデータテーブルのサイズを示す数字を記載する。 #行数<tab>列数と書く。Gihutbの例では”#1203 18"。
3行目には、残りのファイルの各列に関連するサンプルの識別子を記載する。Gihutbの例ではNAME Description AA488_A1.2 AA489_A2.2 AA490_A3 ..."。
データファイルの残りの部分には、各遺伝子のデータを含める。最初の 2列のフィールドは、各遺伝子の説明(アレイではprobe ID、RNAseqでは遺伝子名)と名前(アレイでは記述(NaでもOK)、RNAseqでは遺伝子ID)を記入する。一意の識別子でないといけない。3列目以降の列には発現値を記載する。発現値はGSEApyでは正規化されないので、正規化手順(DESeq2やVoomなど)を用いて予めサンプル間正規化した値になっている必要がある。
必要なファイル2 - 表現型ラベル(Phenotype Labels)
表現型ラベルファイル(cls形式)は、クラスファイルまたはテンプレートファイルとも呼ばれ、表現型ラベルを定義し、それらのラベルを発現データセットのサンプルに割り当てるために使われる。clsはスペース区切りテキストファイル(もしくはタブ区切り)となっている(フォーマットの詳細)。
demoデータ:https://github.com/zqfang/GSEApy/blob/master/tests/data/P53.cls

拡大した。
 CLSファイルのフォーマットは、表現型がカテゴリーか連続かによって多少異なる。カテゴリーラベルは、例えば、正常と腫瘍のように、離散的な表現型を定義する。上の写真では、MUTとWTの2つのクラスを定義していて(50 2 1)、3行目にはこのテキストが合計50記載されている (50 2 1)。
1行目には、サンプル数とクラス数を示す数字を記載する。サンプル数は、関連するRESまたはGCTデータファイルのサンプル数に対応する必要がある( サンプル数<space>クラス数<space>1)。
2行目には、各クラスのユーザーから見える名称を記載する。これは、解析レポートに表示されるクラス名。行頭には#を入れる( MUT<space>WT)。
3行目には各サンプルのクラスラベルをspace区切りで記載する。クラスラベルは、クラス名、数字、テキスト文字列のいずれかを指定する(上の写真ではテキスト)。最初のラベルは2行目のクラス名に割り当てられ、最初のラベルと異なる2番目のラベルは2番目のクラス名に割り当てられ、以下同様。この行で指定するクラスラベルの数は、最初の行で指定したサンプル数と同じにする必要がある。
注:3行目のラベルの順番でクラス名とクラスラベルの関連付けが決まる。重要なのは、3行目が左から右に処理されるとき、最初に見つけたラベルをそれが何であっても受け取り、それを2行目の最初のクラス名(これも左から右)に対応付けることである。一意のラベルの数が名前の数より多い場合はエラーになる。3行目は発現データセットに現れるサンプルを列挙したものなので、2行目のクラス名はサンプル間で最初に遭遇する順番に並べる必要がある(例:0 0 0 ... 1 1)。
必要なファイル3 - 遺伝子セットを記述するためのタブ区切りファイル (GMT: Gene Matrix Transposed file)
GMT形式では各行が遺伝子セットを表す(フォーマットの詳細)。
demoデータ:GSEApy/genes.gmt at master · zqfang/GSEApy · GitHub

GMT形式では、各遺伝子セットは、1列目が名前、2列目が説明、3列目以降が遺伝子セット内の遺伝子で記述される。GSEA は説明フィールド(2列目)を使用して、遺伝子セットの説明に対してレポート内で提供するハイパーリンクを決定する。2列目の説明が "na" の場合、GSEA は MSigDB の名前付き遺伝子セットへのリンクを提供し、説明が URL の場合、GSEA はその URL へのリンクを提供する(URLの例)。複数のGMTをマージしてカスタマイズセットを作りたい時は単純にcatで連結すればよい。
コマンドラインでの実行方法 (test run)
1、GSEA - GSEA の結果を生成するモジュール
入力はtxtファイル(FPKM, Expected Counts, TPM, etc.)、clsファイル、gene_setsファイル(gmtフォーマット)。フォーマットの詳細はGSEAのHPで説明されている(link)。
git clone https://github.com/zqfang/GSEApy.git
cd /GSEApy/tests/data/
gseapy gsea -d exptable.txt -c test.cls -g gene_sets.gmt -o test
- -d Input gene expression dataset file in txt format.Same with GSEA.
- -c Input class vector (phenotype) file in CLS format. Same with GSEA.
- -g Gene set database in GMT format. Same with GSEA.
- -t Permutation type. Same with GSEA, choose from {'gene_set', 'phenotype'}
2、prerank - Prerankツールの結果を生成するモジュール
fold changeやp valueの値でプリランクされている遺伝子リストの検定を行う。入力には相関値を持つpre-rank遺伝子リストデータセット(.rnk形式)とgene_setsファイル(gmt形式)。 prerankモジュールはGSEA pre-rankツールへのAPI。GSEAPrerankedでは表現型ファイルは必要ない。
cd /GSEApy/tests/data/
gseapy prerank -r temp.rnk -g genes.gmt -o test
test/

gseapy.prerank.gene_sets.report.csv

3、ssgsea - single sample GSEA(ssGSEA)解析を行うモジュール
Single-sample GSEA (ssGSEA) は Gene Set Enrichment Analysis (GSEA) の拡張で、サンプルと遺伝子セットの各ペアに対して別々のエンリッチメントスコアを計算する。 各ssGSEAののエンリッチメントスコアは、特定の遺伝子セット内の遺伝子がサンプル内でどの程度協調的にアップレギュレートまたはダウンレギュレートされているかを表す。
入力はpd.Series(遺伝子名でインデックス付け)、またはpd.DataFrame(GCTファイルを含む)、発現値、GMTファイルを想定している。複数サンプル入力の場合、ssGSEAはgctフォーマットも再作成する。遺伝子セットのssGSEAエンリッチメントスコアはD. Barbie et al 2009に記述されている。
cd /GSEApy/tests/data/
gseapy ssgsea -d P53.txt -g genes.gmt -o test

4、replot - GSEAデスクトップのレポートを生成する
cd /GSEApy/tests/data/
 gseapy replot -i edb/ -o test
試した時はエラーになった。
他にも遺伝子IDを変換するbiomartコマンドやenrichrを実行するenrichrコマンドが利用できます。
GSEA software download ; http://www.gsea-msigdb.org/gsea/downloads.jsp

マニュアルでは、pythonのコンソール上(jupyterなど)で利用する方法が詳しく説明されています。興味がある方は確認して下さい。
引用
https://github.com/zqfang/GSEApy
”If you use gseapy in your research, you should cite the original ``GSEA`` and ``Enrichr`` paper.”
参考
関連
2022/02/16
Finding gene sets for running GSEA with mouse data is a challenge. The msigdbr package is *excellent* but folks not proficient with R still need access to the gmt files to run the java app. I have made these available here: https://t.co/vKWy534Sgj#genomics
— Mark Ziemann (@mdziemann) 2022年2月16日