deeptools2のペーパーより
ハイスループットシーケンスデータのデータの分析は、引き続き研究者にとって大きな課題となっている。ハイスループットシーケンシングを用いた実験の多様性が急速に高まっているため、分析パッケージの数が増加し、洞察に富んだ視覚化や下流分析が可能になった(ChAsE(論文より ref.1)、ChIP-seq Webサーバー(link)(ref.2)、Homer(ref.3)、ngs.plot(ref.4))。これらのツールの多くは、コマンドラインの使用経験と品質管理され適切に正規化されている入力データを必要とする。その結果、多くの研究グループには依然としてディープシーケンシング技術で生成されたデータを処理して分析する能力がない。これを念頭に置いて、著者らは、公開されてアクセス可能なGalaxyインスタンス(ref.5)内で実装した、高速で使いやすいツールのモジュールスイートである、deepToolsを開発した。 deepToolsは、さまざまな品質管理、異なる正規化スキーム、ゲノム全体の視覚化など、幅広い機能をサポートしている。 deepToolsの本来のpublish以来、生物学者やバイオインフォマティクスからの頻繁な要求によって動機づけられて、数多くのパフォーマンスの改善と範囲の拡大を伴った10のリリースを発表した。このプロセスでは、コードの大部分を書き直し、ドキュメントを改訂し、サーバーのハードウェアを更新した。ディープシーケンシングデータを処理してフィルタリングする新しい方法を追加し、品質管理と分析のための新しいツールを提供し、ドキュメントとサンプルを更新した。さらに、計算速度を大幅に向上させ(時には最大100倍)、ほとんどのコンポーネントの自動テストを拡張し、他のユーザーがdeepToolsの機能を自分のプログラムにシームレスに組み込むことを可能にするAPIを作成した。ここでは、最新のリリース(deepTools2)とそれに関連するGalaxyプラットフォーム(ref.6)に基づいたWebサーバーを紹介する。これにより、特殊なリソースやサーバーにアクセスできないユーザーは、再現性の高い分析のためのシンプルで柔軟なフレームワークの恩恵を受けることができる。
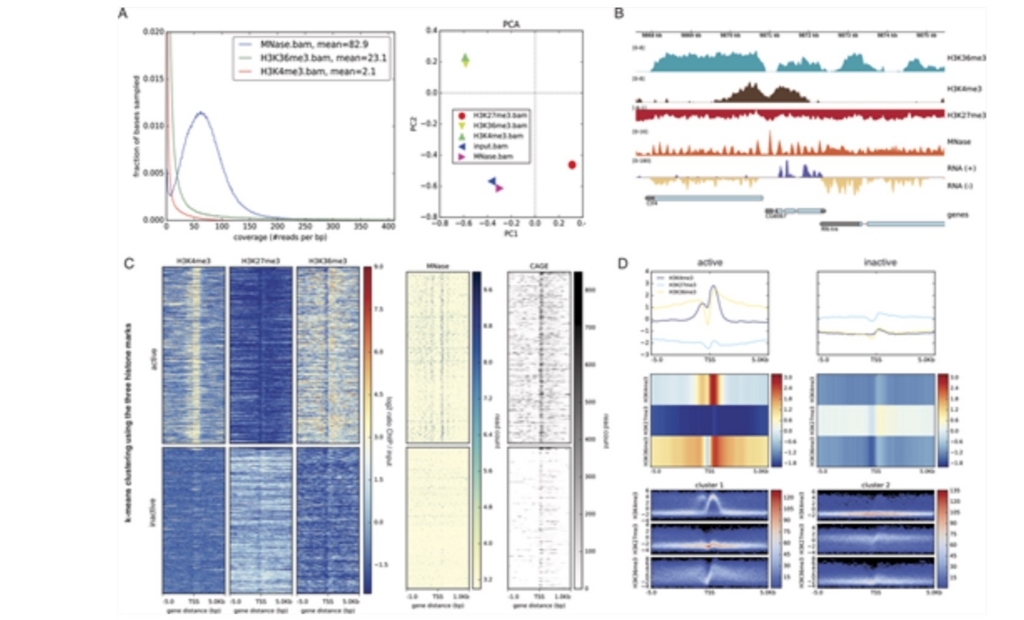
deeptoolsを使うことで、様々な分析を実行できる。論文より転載。
Galaxyでもバージョン3になったdeeptoolsを使える(galaxyへの実装が先)。ここではdeeptools3.02をローカル環境で実行する流れを紹介する。
インストール
mac10.12のPython 3.5.2 :: Anaconda custom (64-bit)環境に導入した( plotするツールのいくつかははpython3環境でのみ動作した。)。
依存
- From version 2.3 onwards, deepTools support python3.
本体
#bioconda (link)
conda install -c bioconda deeptools
> deeptools -h
$ deeptools -h
usage: deeptools [-h] [--version]
deepTools is a suite of python tools particularly developed for the efficient analysis of
high-throughput sequencing data, such as ChIP-seq, RNA-seq or MNase-seq.
Each tool should be called by its own name as in the following example:
$ bamCoverage -b reads.bam -o coverage.bw
If you find deepTools useful for your research please cite as:
Ramírez, Fidel, Devon P. Ryan, Björn Grüning, Vivek Bhardwaj, Fabian Kilpert,
Andreas S. Richter, Steffen Heyne, Friederike Dündar,
and Thomas Manke. 2016. "deepTools2: A next Generation Web Server for Deep-Sequencing
Data Analysis." Nucleic Acids Research, April. doi:10.1093/nar/gkw257.
[ Tools for BAM and bigWig file processing ]
multiBamSummary compute read coverages over bam files. Output used for plotCorrelation or plotPCA
multiBigwigSummary extract scores from bigwig files. Output used for plotCorrelation or plotPCA
correctGCBias corrects GC bias from bam file. Don't use it with ChIP data
bamCoverage computes read coverage per bins or regions
bamCompare computes log2 ratio and other operations of read coverage of two samples per bins or regions
bigwigCompare computes log2 ratio and other operations from bigwig scores of two samples per bins or regions
computeMatrix prepares the data from bigwig scores for plotting with plotHeatmap or plotProfile
alignmentSieve filters BAM alignments according to specified parameters, optionally producing a BEDPE file
[ Tools for QC ]
plotCorrelation plots heatmaps or scatterplots of data correlation
plotPCA plots PCA
plotFingerprint plots the distribution of enriched regions
bamPEFragmentSize returns the read length and paired-end distance from a bam file
computeGCBias computes and plots the GC bias of a sample
plotCoverage plots a histogram of read coverage
estimateReadFiltering estimates the number of reads that will be filtered from a BAM file or files given certain criteria
[Heatmaps and summary plots]
plotHeatmap plots one or multiple heatmaps of user selected regions over different genomic scores
plotProfile plots the average profile of user selected regions over different genomic scores
plotEnrichment plots the read/fragment coverage of one or more sets of regions
[Miscellaneous]
computeMatrixOperations Modifies the output of computeMatrix in a variety of ways.
For more information visit: http://deeptools.readthedocs.org
optional arguments:
-h, --help show this help message and exit
--version show program's version number and exit
2018年6月現在ではバージョン3.02が導入される。
ラン
高速化のオプションは全ツールで共通です。エラーが起きたら消してください、
- -p Number of processors to use
どのツールも大量のオプションがあります。リンク先の説明を見てから実行して下さい。 各ツールごとのヘルプもあります。例えば "multiBamSummary bins -h"でヘルプが出ます 。bamを使った解析にはbamのindexも必要です。作ってなければ"samtools index input,.bam"してください。
1、multiBamSummary(リンク)
複数のbamファイルを比較する。
1、bins
10kbのbinサイズで、複数bam間のゲノムワイドなカバレッジ比較を行う。結果はplotCorrelation(リンク)で可視化できる。相関係数も出力される。相関係数はピアソン以外にスピアマンの相関係数も利用できる。
multiBamSummary bins --bamfiles file1.bam file2.bam file3.bam -p 4 \
-o results.npz --outRawCounts readCounts.tab \
--region chr1 --minMappingQuality 30 --labels sample1 sample2 sample3

#可視化。
plotCorrelation -in results.npz -c <pearson or spearman> -p scatterplot -o output
- -p Number of processors to use.
- -r Region of the genome to limit the operation to - this is useful when testing parameters to reduce the computing time. The format is chr:start:end, for example –region chr10 or –region chr10:456700:891000.
- -o File name to save the coverage matrix. This matrix can be subsequently plotted using plotCorrelation or or plotPCA.
- --binSize Length in bases of the window used to sample the genome (default 10kb).
- -outRawCounts Save the counts per region to a tab-delimited file.
- --verbose Set to see processing messages.
- --ignoreDuplicates If set, reads that have the same orientation and start position will be considered only once. If reads are paired, the mate’s position also has to coincide to ignore a read.
- --minMappingQuality If set, only reads that have a mapping quality score of at least this are considered.
- --labels User defined labels instead of default labels from file names. Multiple labels have to be separated by a space, e.g. –labels sample1 sample2 sample3

またはheatmapを描画する(リンク)。
plotCorrelation -in results.npz -c pearson --skipZeros --whatToPlot heatmap \
--colorMap RdYlBu --plotNumbers -o heatmap_SpearmanCorr_readCounts.png \
--plotTitle "Spearman Correlation of Read Counts"

2、BED-file
特定の領域のカバレッジだけを比較する。
multiBamSummary BED-file --BED selection.bed --bamfiles file1.bam file2.bam -o results.npz
- --BED Limits the coverage analysis to the regions specified in these files.
2、multiBigwigSummary(リンク)
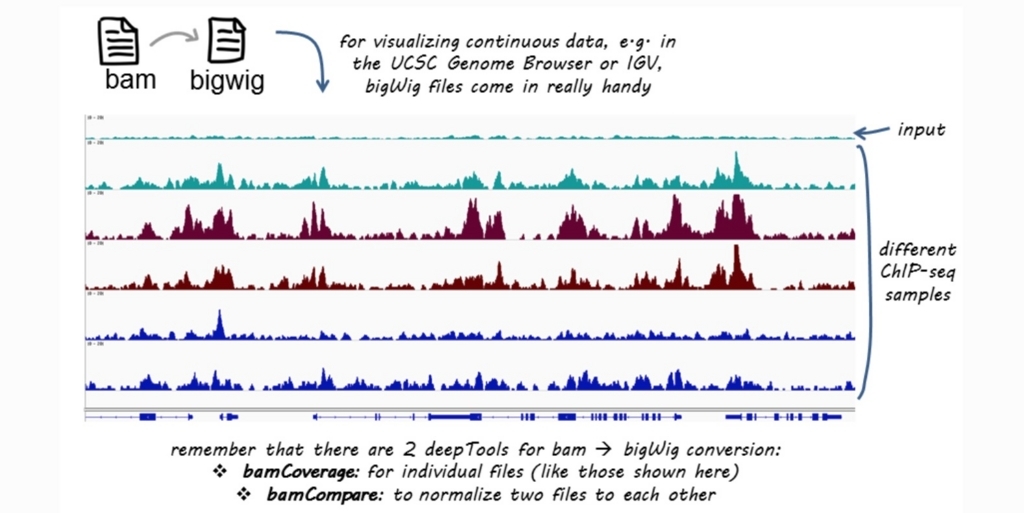
複数のbigwigファイルを比較する。bigwig作成の方法はUCSCのHPに記載されている(UCSCリンク)。または本ツールのコマンドの1つbamCoverageを使う。
0、bigwigの作成(紹介)。
bamCoverage --bam input.bam -o output.bw -of bigwig --binSize=10 --minMappingQuality 10 --numberOfProcessors=max
1、bins
一定のbinサイズで比較。
multiBigwigSummary bins -b file1.bw file2.bw -o results.npz
2、BED-file
特定の領域だけを比較する。
multiBigwigSummary BED-file -b file1.bw file2.bw -o results.npz --BED selection.bed
3、computeGCBias(リンク)とcorrectGCBias(リンク)
GCバイアスを補正する。カバレッジが極端に高い領域(典型的にはGC rich)のリードの一定数をカバレッジが極端に低い領域(典型的にはAT rich)に渡す。2012年の論文で提唱された方法を元にしている(pubmed)。
1、GCバイアステーブルの作成。ランに必要なリファレンスFASTAは2bit変換しておく必要がある。UCSCからダウンロードするかkentutilitiesのfaToTwoBitで2bit変換する(東大の中戸さんのfaToTwoBitダウンロード説明HP)。
#2bit変換したゲノムを作成(無い場合だけ)
faToTwoBit ref.fa ref.2bit

#GCbiasを計算
computeGCBias -b file.bam --effectiveGenomeSize 2150570000 --genome ref.2bit -l 200 --GCbiasFrequenciesFile freq.txt
- --effectiveGenomeSize The effective genome size is the portion of the genome that is mappable. Large fractions of the genome are stretches of NNNN that should be discarded. Also, if repetitive regions were not included in the mapping of reads, the effective genome size needs to be adjusted accordingly. A table of values is available here: http://deeptools.readthedocs.io/en/latest/content/feature/effectiveGenomeSize.html
- --genome Genome in two bit format. Most genomes can be found here: http://hgdownload.cse.ucsc.edu/gbdb/ Search for the .2bit ending. Otherwise, fasta files can be converted to 2bit using the UCSC programm called faToTwoBit available for different plattforms at http://hgdownload.cse.ucsc.edu/admin/exe/.
- --GCbiasFrequenciesFile Path to save the file containing the observed and expected read frequencies per %GC-content. This file is needed to run the correctGCBias tool. This is a text file.
- -l Fragment length used for the sequencing. If paired-end reads are used, the fragment length is computed based from the bam file
2、1で出力されたfreq.txtを使い、bamのGCbiasを補正する。
correctGCBias -b file.bam --effectiveGenomeSize 2150570000 -g mm9.2bit --GCbiasFrequenciesFile freq.txt -o gc_corrected.bam [options]
補正されたbamが出力される。
4、bamCompare(リンク)
一定のbinサイズにゲノムを分割し、binあたりのマッピング数を比較する。計算結果はbigwigで出力される。

公式HPより。
2サンプル間のカバレッジを比較する。
bamCompare -b1 treatment.bam -b2 control.bam -o log2ratio.bw
bigwigファイルを比較するならbigwigCompare(リンク)を使う。
5、computeMatrix(リンク)、および結果を描画するplotHeatmap(リンク)と plotProfile(リンク)。
ゲノム領域ごとのスコアを計算し、plotHeatmapおよびplotProfilesで使用できる中間ファイルを作成する。 ゲノム領域は遺伝子が典型だが、BEDファイルに定義すれば他の任意の領域も用いることができる。 複数のスコアファイル(bigWig形式)と複数のリージョンファイル(BED形式)を受け入れる。 また、このツールを使用して、スコアに基づいて領域をフィルタリングおよびソートすることもできる。
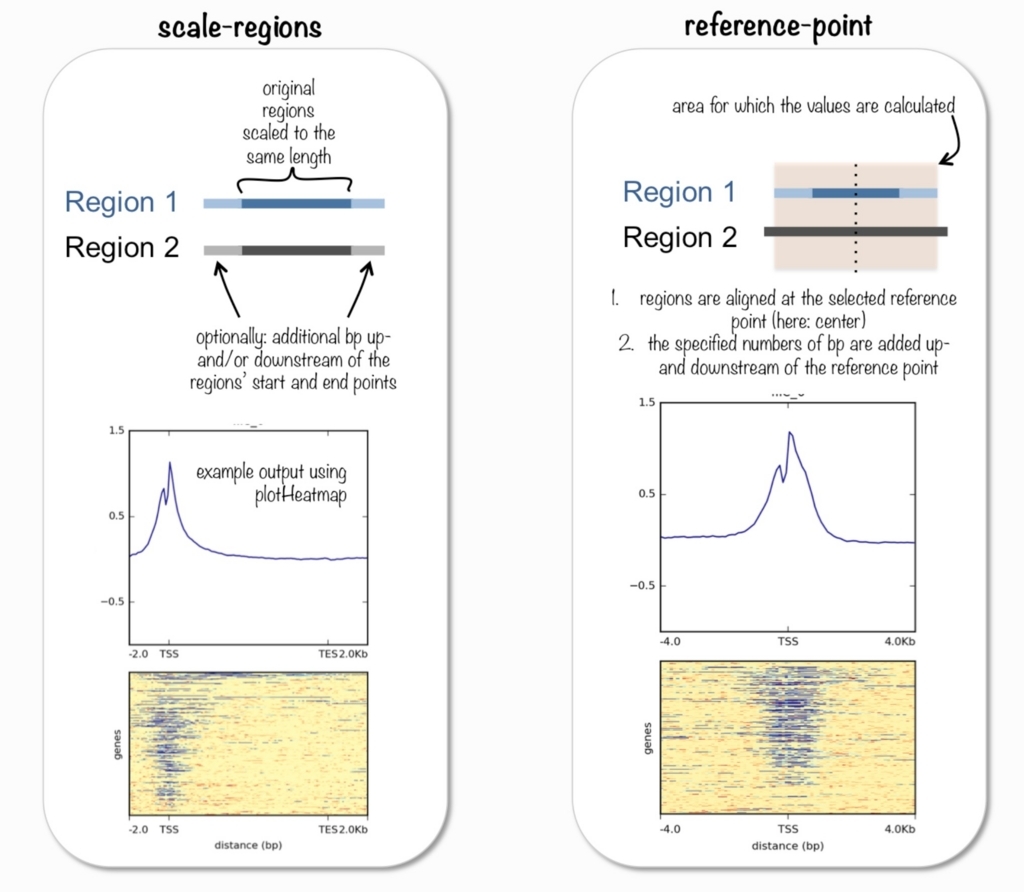
2つの計算モードがある。公式より転載。
1、scale-regions
スケール領域モードでは、上の図のように、BEDファイル内のすべての領域がユーザーが指定した長さ(base)に伸縮してカウントされる(BEDの各領域が同じ長さまで伸び縮みする)。
computeMatrix scale-regions -S sample1_biwig sample2_biwig -R input.bed -b 1000 -o matrix.mat.gz -p 8
- -R File name or names, in BED or GTF format, containing the regions to plot. If multiple bed files are given, each one is considered a group that can be plotted separately. Also, adding a “#” symbol in the bed file causes all the regions until the previous “#” to be considered one group.
- -S bigWig file(s) containing the scores to be plotted. Multiple files should be separated by spaced. BigWig files can be obtained by using the bamCoverage or bamCompare tools.
- -b Distance upstream of the start site of the regions defined in the region file. If the regions are genes, this would be the distance upstream of the transcription start site.
- -a Distance downstream of the end site of the given regions. If the regions are genes, this would be the distance downstream of the transcription end site.
2、reference-point
reference-pointは、ユーザーが指定したBED領域内の位置を意味する。基準点の前(上流)および/または後(下流)のユーザーが指定したサイズのみがプロットされる(伸び縮みしない)。
各遺伝子の転写される領域をBEDファイルで指定し、bigwigから転写開始点の上流3000 bpと下流3000 bpだけをプロットする。
computeMatrix reference-point -S input_biwig -R input.bed -a 3000 -b 3000 -o matrix.mat.gz -p 8
- --referencePoint Possible choices: TSS, TES, center
The reference point for the plotting could be either the region start (TSS), the region end (TES) or the center of the region. Note that regardless of what you specify, plotHeatmap/plotProfile will default to using “TSS” as the label.
次に結果を可視化する。
結果の可視化方法も、2種類の方法から選ぶ。以下のような基準で考える。
2つの描画モードがある。公式より転載。
#上と重複するが、まずcomputeMatrixを実行する。
computeMatrix scale-regions -S H3K27Me3-input.bigWig \
H3K4Me1-Input.bigWig H3K4Me3-Input.bigWig -R genes19.bed genesX.bed \
--beforeRegionStartLength 3000 --regionBodyLength 5000 \
--afterRegionStartLength 3000 --skipZeros -o matrix.mat.gz -p 8

#computeMatrixの結果を可視化する。可視化例1
plotHeatmap -m matrix.mat.gz -out ExampleHeatmap1.png

#可視化例2
plotHeatmap -m matrix.mat.gz -out ExampleHeatmap2.png \
--colorMap RdBu --whatToShow 'heatmap and colorbar' --zMin -3 --zMax 3 \
--kmeans 4
例1出力。grepでbedからTSSだけ抽出して上流下3kbずつplotした。タイトルが被っているが、入力のbigwigファイル名を短くするか、フォントサイズを変更する。

例2出力。#同様にフォントサイズ要修正。

plotProfile(リンク)
#まずcomputeMatrixを実行する
computeMatrix scale-regions -S H3K27Me3-input.bigWig H3K4Me1-Input.bigWig \
H3K4Me3-Input.bigWig -R genes19.bed genesX.bed --beforeRegionStartLength 3000 \
--regionBodyLength 5000 --afterRegionStartLength 3000 --skipZeros -o  matrix.mat.gz -p 8

#可視化例1
plotProfile -m matrix.mat.gz -out ExampleProfile1.png --numPlotsPerRow 2 \
--plotTitle "Test data profile"

#可視化例2
plotProfile -m matrix.mat.gz -out ExampleProfile2.png --plotType=fill \
--perGroup --colors red yellow blue --plotTitle "Test data profile"

#可視化例3
plotProfile -m matrix.mat.gz --perGroup --kmeans 2 --plotType heatmap \
-out ExampleProfile3.png
例1出力。

例2出力。

例3出力。

サンプル名に統一性がないのは無視してください、ミスです。入力ファイル名にルールをつければ防げます。
6、alignmentSieve(リンク)
BAM、CRAMを特定の条件でフィルタリングする。
alignmentSieve -b paired_chr2L.bam --minMappingQuality 5 --samFlagInclude 16 \
--samFlagExclude 256 --ignoreDuplicates -o filtered.bam --filterMetrics metrics.txt
- --minMappingQuality If set, only reads that have a mapping quality score of at least this are considered.
- --samFlagInclude Include reads based on the SAM flag. For example, to get only reads that are the first mate, use a flag of 64. This is useful to count properly paired reads only once, as otherwise the second mate will be also considered for the coverage.
- --samFlagExclude Exclude reads based on the SAM flag. For example, to get only reads that map to the forward strand, use –samFlagExclude 16, where 16 is the SAM flag for reads that map to the reverse strand.
- --ignoreDuplicates If set, reads that have the same orientation and start position will be considered only once. If reads are paired, the mate’s position also has to coincide to ignore a read.
- --shift Shift the left and right end of a read (for BAM files) or a fragment (for BED files). (詳細はHP参照。下の方に絵を使って説明されています)
7、plotPCA(リンク)
1のmultiBamSummaryコマンドや2のmultiBigwigSummaryコマンド出力から、主成分分析(PCA)を行い、結果のグラフを出力する。
plotPCA -in readCounts.npz -o PCA_readCounts.png -T "PCA of read counts"
- -T Title of the plot, to be printed on top of the generated image. Leave blank for no title.

8、plotFingerprint(リンク)
インデックス付きのBAMファイルをサンプリングし、それぞれの累積カバレッジをプロットする。 指定された長さのウィンドウ(ビン)に重複するすべてのリードがカウントされる。
plotFingerprint -b treatment.bam control.bam -plot fingerprint.png
グラフが意味することについては"What the plot tells you"を読んでください。
9、bamPEFragmentSize(リンク)
ペアエンドシーケンシングのBAMファイルを使用して、ペアのフラグメントサイズを計算する。統計的に推定するため、ゲノムのサイズとプロセッサ数に応じていくつかの領域がサンプリングされる。
deepTools2.0/bin/bamPEFragmentSize -hist fragmentSize.png \
-T "Fragment size of PE RNA-seq data" --maxFragmentLength 1000 \
-b testFiles/RNAseq_sample1.bam testFiles/RNAseq_sample2.bam \
testFiles/RNAseq_sample3.bam testFiles/RNAseq_sample4.bam \
-samplesLabel sample1 sample2 sample3 sample4
10、plotCoverage(リンク)
サンプルのシーケンスデプスを評価する。 100万bpサンプリングし、重複するリード数をカウントし、どのくらいの数の塩基が何回含まれているかを示すヒストグラムを報告する。 複数のBAMファイルを受け入れられるが、ほかのツールと同様、すべて同じゲノムにアライメントしている必要がある。
plotCoverage -b H3K4Me1.bam H3K4Me3.bam H3K27Me3.bam H3K9Me3.bam --plotFile example_coverage -n 1000000 --plotTitle "example_coverage" \
--outRawCounts coverage.tab --ignoreDuplicates \
--minMappingQuality 10 --region 19
11、plotEnrichment(リンク)
BED形式またはGTF形式のいずれかの領域でリードデプスがエンリッチしているかどうかを計算およびプロットするためのツール。 基礎となるデータポイントも出力することができる。 BEDファイル内の領域は、「ピーク」機能に割り当てられる。
plotEnrichment -b Input.bam H3K4Me1.bam H3K4Me3.bam --BED up.bed down.bed \
--regionLabels "up regulated" "down regulated" -o enrichment.png
12、 estimateReadFiltering(リンク)
deepTools内の多くのツールは、マッピングのクオリティやその他の基準に従ってBAMファイルをフィルタリングできるが、 さまざまな設定がフィルタリングされたリード数にどのように影響するかを事前に知ることは困難である。 estimateReadFilteringを使用すると、1つまたは複数の条件に従ってフィルタリングされるBAMファイルまたはファイルのリード数を見積もることができる。
estimateReadFiltering -b paired_chr2L.bam --minMappingQuality 5 \
--samFlagInclude 16 --samFlagExclude 256 --ignoreDuplicates
このほか、以下のようなコマンドがあります
大阪大学医学部 Python会のyyasumizuさんがChip-SeqでのdeepToolsの活用例についてまとめられています。リンクありがとうございます。
引用
deepTools2: a next generation web server for deep-sequencing data analysis
Ramírez F, Ryan DP, Grüning B, Bhardwaj V, Kilpert F, Richter AS, Heyne S, Dündar F, Manke T
Nucleic Acids Res. 2016 Jul 8;44(W1):W160-5.
deepTools: a flexible platform for exploring deep-sequencing data
Fidel Ramírez, Friederike Dündar, Sarah Diehl, Björn A. Grüning, and Thomas Manke
Nucleic Acids Res. 2014 Jul 1
参考ページ
2bit genome を作成する - Palmsonntagmorgen
Galaxy deeptools解説
https://github.com/deeptools/deepTools/wiki/Visualizations
関連

