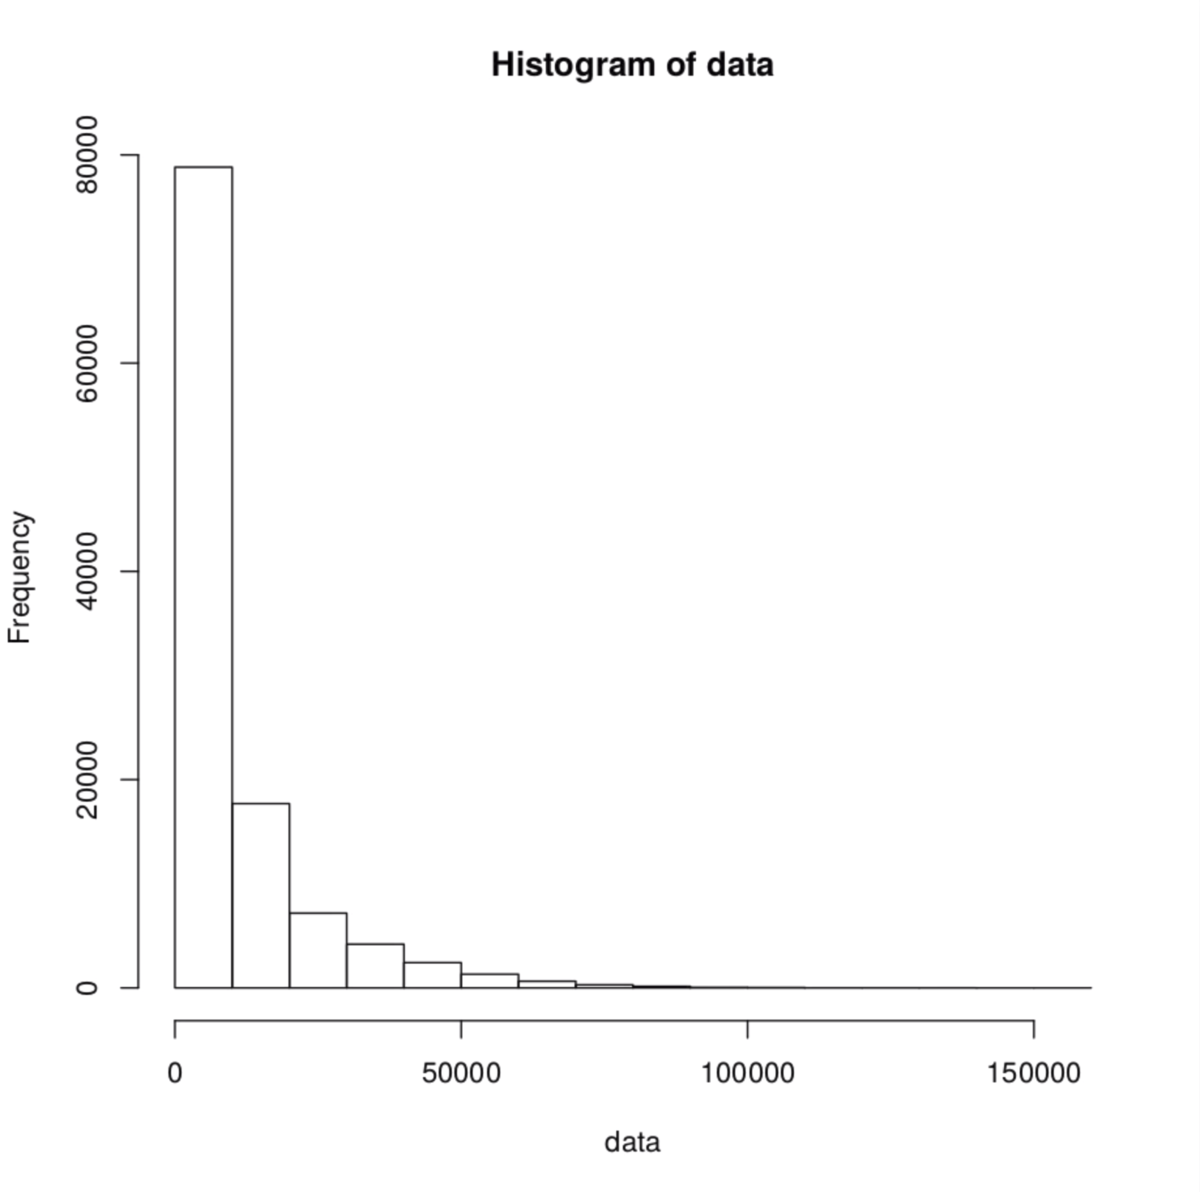
pyfaidxとRのhistを使えばワンライナーで出力できる。
インストール
#python (link)
pip install pyfaidx
実行方法
FASTAファイルを指定する。
faidx --transform chromsizes input.fa | cut -f2 | Rscript -e 'data <- as.numeric (readLines ("stdin")); summary(data); hist(data)'
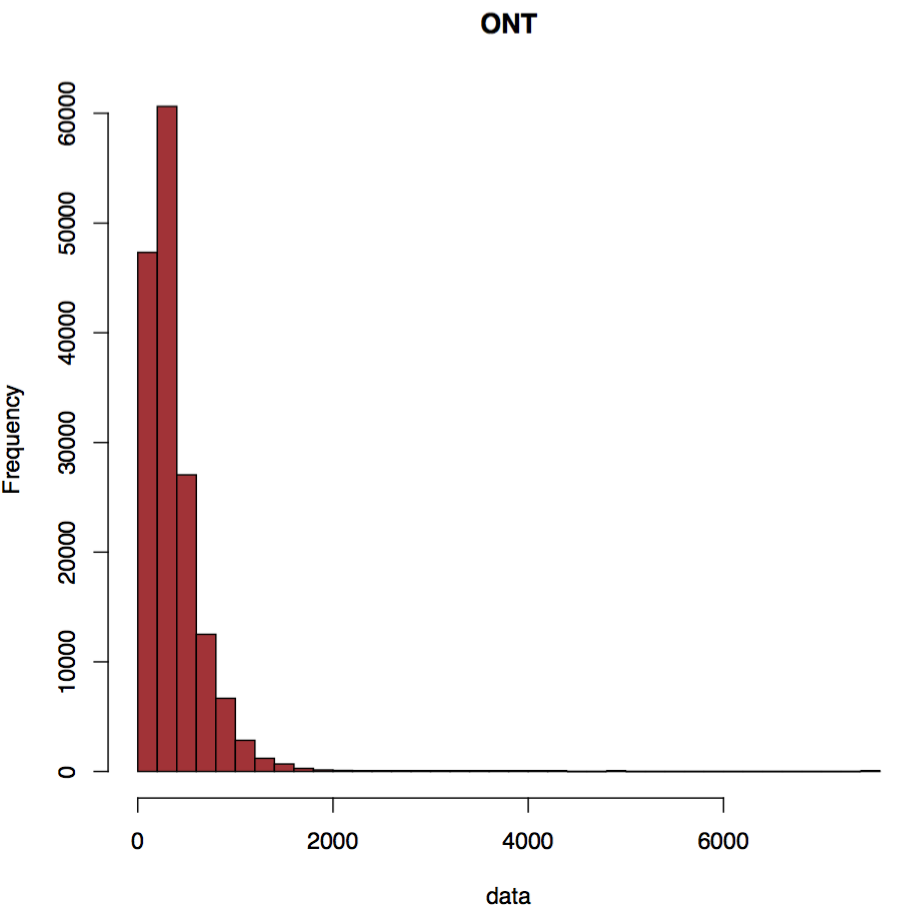
ONTのリード

色#993435(link)をつける。区切りは30とする。タイトル はONTとする。
faidx --transform chromsizes input.fa | cut -f2 | Rscript -e 'data <- as.numeric (readLines ("stdin")); summary(data); hist(data,breaks=30, main = "ONT",col = "#993435")'

またはsamtoolsのfaidxコマンドを使う。
samtools faidx input.fasta
cut -f2 input.fasta.fai | Rscript -e 'data <- as.numeric (readLines ("stdin")); summary(data); hist(data)'
引用
Read length distribution from FASTA file
nanopore - Read length distribution from FASTA file - Bioinformatics Stack Exchange