macでインフォマティクス

macでインフォマティクス

HTS (NGS) 関連のインフォマティクス情報についてまとめています。

S. cerevisiaeの変異を同定するための自動化されたパイプライン MutantHuntWGS


 MutantHuntWGSは、Saccharomyces cerevisiaeの全ゲノムシーケンスデータを解析するためのユーザーフレンドリーなパイプラインである。オープンソースのプログラムを使用している。(1) ペアエンドおよびシングルエンドリードのシークエンスアラインメント、(2) バリアントのコール、(3) バリアントの影響と重症度の予測。MutantHuntWGS は、バリアントのショートリストを出力すると同時に、すべての中間ファイルへのアクセスを可能にする。その有用性を実証するため、MutantHuntWGSを使用して複数の公開データセットを評価したところ、すべてのケースで、文献で報告されているのと同じ原因バリアントを検出することができた。広範な採用を奨励し、再現性を促進するために、MutantHuntWGSパイプラインのコンテナ化バージョンを配布し、ユーザーがたった2つのコマンドでインストールとデータ解析を行えるようにしている。MutantHuntWGSソフトウェアとドキュメントは、https://github.com/mae92/MutantHuntWGS から無料でダウンロードできる。


 MutantHuntWGSパイプラインは、オープンソースバイオインフォマティクスツールとUnixコマンドを統合したもので、生のシーケンスリード(圧縮FASTQフォーマットまたは.fastq.gz)およびプロイド情報を含むテキストファイルを入力として受け取り、シーケンスバリアントのリストを出力として生成する。ユーザーは、少なくとも2つの株(対照株と1つ以上の実験株)の入力データを提供する必要がある。パイプラインは、(1)Bowtie2による各入力サンプルのリードとリファレンスゲノムとのアライメント、(2)SAMtoolsによるデータ処理と遺伝子型尤度の計算,(3)BCFtools によるバリアントのコール, (4)VCFtoolsおよびカスタムシェルコマンドを使用して実験株と対照株で見つかったバリアントを比較し、(5)SnpEffおよびSIFTを使用して注釈付き遺伝子に関連してバリアントが見つかった場所と影響を受けた遺伝子製品の発現および機能に対する潜在的な影響を評価する(論文図1)。パイプラインで使用されるコマンドの詳細な説明とすべてのコードは、MutantHuntWGS Gitリポジトリhttps://github.com/mae92/MutantHuntWGS; README.md, Supplemental_Methods.docx ファイル参照)で入手できる。


インストール

ubuntu18.04で公式のdockerイメージを使ってテストした。

Github

git clone https://github.com/mae92/MutantHuntWGS.git

#dockerhub
docker pull mellison/mutant_hunt_wgs:version1


実行方法

1、ファイルの準備

Analysis_Directoryを作成し、その中にFASTQというディレクトリを作成する。その中に全てのFASTQファイルを配置する。

mkdir -p Analysis_Directory/FASTQ
cp <your>/*fastq.gz Analysis_Directory/FASTQ/

FASTQファイルはgzip圧縮されていて、以下の命令規則に従っている必要がある。

  • シングルエンドfastq;xxx.fastq.gz
  • ペアエンドfastq;xxx_R1.fastq.gzとxxx_R2.fastq.gz

xxx部分でスペースや句読点、アンダースコア("_")は使用してはならない。


2、dockerイメージを立ち上げる。先ほど作成したディレクトリを共有ディレクトリとして指定する。

docker run --rm -it -v /<PATH>/<TO>/<YOUR>/Analysis_Directory:/Main/Analysis_Directory mellison/mutant_hunt_wgs:version1


3、MutantHuntWGSのラン。genomeのfastaファイルとindexファイルはdocker imagesに含まれる(Saccharomyces cerevisiae S288C?)。


#テストランが可能

MutantHuntWGS.sh \
-n wttoy -g /Main/MutantHuntWGS/S_cerevisiae_Bowtie2_Index_and_FASTA/genome \
-f /Main/MutantHuntWGS/S_cerevisiae_Bowtie2_Index_and_FASTA/genome.fa \
-p /Main/MutantHuntWGS/S_cerevisiae_Bowtie2_Index_and_FASTA/ploidy_n1.txt \ -d /Main/MutantHuntWGS/FASTQ_test \
-o /Main/Analysis_Directory/test_output \
-a YES -r single -s 0

テストランは数十秒で終わる。Analysis_Directory/にtest_outputディレクトリができる。

f:id:kazumaxneo:20211229140520p:plain


実際のシークエンスデータを使ったランでは、"-d"オプションで/Main/Analysis_Directory/FASTQを指定する。

MutantHuntWGS.sh \
-n wttoy -g /Main/MutantHuntWGS/S_cerevisiae_Bowtie2_Index_and_FASTA/genome \
-f /Main/MutantHuntWGS/S_cerevisiae_Bowtie2_Index_and_FASTA/genome.fa \
-p /Main/MutantHuntWGS/S_cerevisiae_Bowtie2_Index_and_FASTA/ploidy_n1.txt \ -d /Main/Analysis_Directory/FASTQ \
-o /Main/Analysis_Directory/output \
-a YES -r single -s 0 -t 8

  • -n     The -n option takes the prefix of the FASTQ file name for the wild-type strain. For the example of FILENAME.fastq or FILENAME_R1.fastq this prefix would simply be "FILENAME".

  • -g    The -g option takes the file PATH to the bowtie index files and the file prefix (genome). Use exactly what is shown above for this command.

  • -f    The -f option takes the file PATH and file name of the genome FASTA file (genome.fa) Use exactly what is shown above for this command.

  • -r   The -r option specifies whether the input data contains paired-end or single-end reads and can take values of "paired" or "single".

  • -s   The -s option takes a score cutoff for the variant scores. This score is calculated by the following formula: -10 * log10(P) where P is the probability that the variant call (ALT) in the VCF file is wrong.

    -p    The -p option takes the file PATH and file name of the ploidy file (genome.fa) Use exactly what is shown above for this command.

  • -d    Directory containing your FASTQ files. If you set things up in the way that the instructions outline above this should stay the same as the example: /PATH_TO_DESKTOP/Analysis_Directory/FASTQ. Use exactly what is shown above for this command.

    -o   This allows you to specify a folder for your data to output to. This should be structured like the example /Main/Analysis_Directory/NAME_YOUR_OUTPUT_FOLDER except you will come up with a descriptive name to replace the NAME_YOUR_OUTPUT_FOLDER part of the file PATH.

    -a   This allows you to turn on and off the alignment and calling step. So if you have already aligned reads and called variants and all that you want to do is reanalyze with a different score cuttoff then you can set this to "NO", but if you are starting from FASTQ files that have not gone throught this process yet you set this to "YES"

  • -t (version 1.1 only)   This allows you to set a number of concurrent threads that will be used when running bowtie2. This is equivolent to setting -p/--threads in bowtie2.


引用

MutantHuntWGS: A Pipeline for Identifying Saccharomyces cerevisiae Mutations 
Mitchell A Ellison, Jennifer L Walker, Patrick J Ropp, Jacob D Durrant, Karen M Arndt
G3 Genes|Genomes|Genetics, Volume 10, Issue 9, 1 September 2020, Pages 3009–3014


DEXseqを使ってSuperTranscriptsの発現解析を行うTrinityのdexseq_wrapper.plスクリプト


DEX-SeqをSupertranscriptsに適用することで、ある条件や処理に反応してリードカバレッジが統計的に有意な差を示す異なる転写産物セグメントを介して、 differential transcript usage(DTU)を探索することが可能。

TrinityツールキットのDTU解析のためのミニパイプラインdexseq_wrapper.pl は、SuperTranscriptsのリードをアライメントし、「エクソン」領域にアライメントしたリードをカウントし、exonレベルの差分発現解析を実行するたのに利用できる。

Trinityのマニュアルに習い、使い方を確認しておく。

(DEXseqとともにアライナーのSTARやHISAT2をラップしたTrinityスクリプト内にカプセル化されており、依存ツールがインストールされていれば実行出来る)


インストール

ubuntu18.04でtrinityの仮想環境を作ってテストした。

依存

  • Trinity
  • Subreadパッケージに含まれるfeatureCountsソフトウェア
  • STARまたはHISAT2アライナー
  • htseq
  • DEXseq

Github

mamba create -n trinity python=3.8
conda activate trinity
mamba install -c bioconda -y trinity

mamba install -c bioconda -y htseq hisat2 star subread

> trinityrnaseq/Analysis/SuperTranscripts/DTU/dexseq_wrapper.pl

#################################################################

#

#  Required:

#

#  --genes_fasta <string>     Trinity genes fasta files

#

#  --genes_gtf <string>       Trinity genes gtf file

#

#  --samples_file <string>            Trinity samples file

#

#  --aligner <string>         aligner to use: STAR|HISAT2

#

#  Optional:

#

#  --out_prefix <string>             default: 'dexseq'

#

#  --SS_lib_type <string>            strand-specific library type 'RF|FR|R|F'

#

#  --CPU <int>                       default: 2

#

#  --top_genes_plot <int>            default: 50

# 

# ## STAR-specific

#

#  --genomeSAindexNbases <int>   param for STAR, default computed as: min(18, int(log((-s $genome) / $num_contigs) / log(2) + 0.5) )                           # 

#

#

################################################################


実行方法

1、Trinityのアセンブリからsupertranscripts構築する(前回の記事)。

Trinity_gene_splice_modeler.py --trinity_fasta Trinity.fasta

trinity_genes.gtfとtrinity_genes.fastaが出力される。


2、dexseq_wrapper.plのラン

ランにはリストファイルが必要。リストファイルはTrinityの他のスクリプトの時と同様、サンプルグループ名<tab>反復名<tab>ペアエンドR1<tab>ペアエンドR2、のタブ区切りファイルで書く(シングルエンドなら4列目は不要)。

cond_A    cond_A_rep1    A_rep1_left.fq    A_rep1_right.fq
cond_A    cond_A_rep2    A_rep2_left.fq    A_rep2_right.fq
cond_B    cond_B_rep1    B_rep1_left.fq    B_rep1_right.fq
cond_B    cond_B_rep2    B_rep2_left.fq    B_rep2_right.fq


dexseq_wrapperをランする。DTU解析のためのこのパイプラインは、SuperTranscriptsのリードをアライメントし、exonレベルの差分発現解析を実行する。

git clone https://github.com/trinityrnaseq/trinityrnaseq.git

perl trinityrnaseq/Analysis/SuperTranscripts/DTU/dexseq_wrapper.pl \
--genes_fasta trinity_genes.fasta \
--genes_gtf trinity_genes.gtf \
--samples_file list \
--out_prefix DTU --aligner HISAT2 --CPU 20
  • --genes_fasta <string>    Trinity genes fasta files
  • --genes_gtf <string>       Trinity genes gtf file
  • --samples_file <string>   Trinity samples file
  • --aligner <string>    aligner to use: STAR|HISAT2
  • --SS_lib_type <string>  strand-specific library type 'RF|FR|R|F'
  • --CPU <int>     default: 2
  • --out_prefix <string>   default: 'dexseq'

f:id:kazumaxneo:20211229005118p:plain

f:id:kazumaxneo:20211229005130p:plain

f:id:kazumaxneo:20211229005150p:plain


出力の詳細はマニュアルを確認して下さい。

引用

De novo transcript sequence reconstruction from RNA-seq using the Trinity platform for reference generation and analysis

Brian J Haas, Alexie Papanicolaou, Moran Yassour, Manfred Grabherr, Philip D Blood, Joshua Bowden, Matthew Brian Couger, David Eccles, Bo Li, Matthias Lieber, Matthew D MacManes, Michael Ott, Joshua Orvis, Nathalie Pochet, Francesco Strozzi, Nathan Weeks, Rick Westerman, Thomas William, Colin N Dewey, Robert Henschel, Richard D LeDuc, Nir Friedman , Aviv Regev

Nat Protoc. 2013 Aug;8(8):1494-512


関連


supertranscriptsを構築するTrinityのTrinity_gene_splice_modeler.pyスクリプト


 スーパートランスクリプトとは、 重複のない遺伝子のすべてのエキソン配列が含まれる各遺伝子の代替の表現方法である。SuperTranscriptは、スプライシングアイソフォーム間でユニークな配列領域と共通する配列領域を1つの直線的な配列にまとめることで構築される。Nadia Davidsonらのオリジナルの論文によると、”superTranscriptsの構築は、非モデル生物(図1c)のための多数の分析アプローチを解くことを約束する簡単なポストアセンブリステップである。”とある。

 Trinity toolkitでは、このSuperTranscriptsを構築するためのユーティリティを提供している。これは、Trinityがアセンブル時に活用する遺伝子とアイソフォームの関係や配列グラフ構造に基づいて作成される。SuperTranscriptは、ゲノムフリーde novoトランスクリプトーム組み立ての文脈で有用である。

Trinityのマニュアルに習い、使い方を確認しておく。


インストール

ubuntu18.04でtrinityの仮想環境を作ってテストした。

Github

mamba create -n trinity python=3.8
conda activate trinity
mamba install -c bioconda -y trinity

>  Trinity_gene_splice_modeler.py -h

usage: Trinity_gene_splice_modeler.py [-h] --trinity_fasta TRINITY_FASTA

                                      [--out_prefix OUT_PREFIX]

                                      [--incl_malign] [--debug] [--verbose]

                                      [--no_squeeze] [--no_refinement]

                                      [--incl_cdna] [--incl_dot]

                                      [--restrict_gene_id RESTRICT_GENE_ID]


Converts Trinity Isoform structures into a single gene structure

representation


optional arguments:

  -h, --help            show this help message and exit

  --trinity_fasta TRINITY_FASTA

                        Trinity.fasta file (default: )

  --out_prefix OUT_PREFIX

                        output prefix for fasta and gtf outputs (default:

                        trinity_genes)

  --incl_malign         include multiple alignment formatted output file

                        (default: False)

  --debug               debug mode (default: False)

  --verbose             verbose mode (default: False)

  --no_squeeze          don't merge unbranched stretches of node identifiers

                        (default: False)

  --no_refinement       don't refine splice graph by further collapsing

                        allelic variants (default: False)

  --incl_cdna           rewrite Trinity fasta file using simplified graph

                        structure (default: False)

  --incl_dot            include dot file for gene graph (*warning* single dot

                        file per gene!! use sparingly) (default: False)

  --restrict_gene_id RESTRICT_GENE_ID

                        only process this gene (default: None)


実行方法

Trinityのアセンブリ結果(フィルタリングしてないもの)を指定する。

Trinity_gene_splice_modeler.py --trinity_fasta Trinity.fasta

supertranscriptsであるtrinity_genes.fastaファイル(fasta形式)が出力される。テストした配列ではおよそ半分の配列数になった。平均長とN50は少しだけ短くなった。


Trinityのマニュアルでは、SuperTranscriptsを使った発現解析の手順も説明されています。

https://github.com/trinityrnaseq/trinityrnaseq/wiki/DiffTranscriptUsage


SuperTranscriptsはリファレンスゲノムがない場合に転写産物の特性を調べるのに有効だが、マニュアルによると、ノイズやバイアスもあるので注意するように呼びかけられている。下の論文が参照されている。


引用

De novo transcript sequence reconstruction from RNA-seq using the Trinity platform for reference generation and analysis

Brian J Haas, Alexie Papanicolaou, Moran Yassour, Manfred Grabherr, Philip D Blood, Joshua Bowden, Matthew Brian Couger, David Eccles, Bo Li, Matthias Lieber, Matthew D MacManes, Michael Ott, Joshua Orvis, Nathalie Pochet, Francesco Strozzi, Nathan Weeks, Rick Westerman, Thomas William, Colin N Dewey, Robert Henschel, Richard D LeDuc, Nir Friedman , Aviv Regev

Nat Protoc. 2013 Aug;8(8):1494-512


関連


TrinityアセンブリとTrinotateのアノテーション情報からGOseqによるGO enrichment解析を行うrun_GOseq.plスクリプト


TrinotateとGOseq、Trinityのスクリプトを組み合わせることで、遺伝子セット間の機能的エンリッチメント解析を行うことができる。Trinityのマニュアルに習い、使い方を確認しておく。


インストール

ubuntu18.04でtrinityの仮想環境を作ってテストした。Rのバージョンは4.1.1。

依存

  • R
  • edgeR, limma, DESeq2, ctc, Biobase, gplots, ape, argparse

Github

mamba create -n trinity python=3.8
conda activate trinity
mamba install -c bioconda -y trinity

#Trinotate
git clone https://github.com/Trinotate/Trinotate.git

#GOSeq
if (!requireNamespace("BiocManager", quietly = TRUE))
    install.packages("BiocManager")
BiocManager::install("goseq")

#qvalue
if (!requireNamespace("BiocManager", quietly = TRUE))
    install.packages("BiocManager")
BiocManager::install("qvalue")

> Trinotate/util/extract_GO_assignments_from_Trinotate_xls.pl

#######################################################################

#

#

#  Required:

#

#  --Trinotate_xls <string>      Trinotate.xls file.

#

#  --gene|G or --trans|T         gene or transcript-mode

#

# Optional:

#

#  --include_ancestral_terms|I     climbs the GO DAG, and incorporates

#                                  all parent terms for an assignment.

#

######################################################################  

> trinityrnaseq/Analysis/DifferentialExpression/run_GOseq.pl

###############################################################################################

#

#  --factor_labeling <string>       tab delimited file with format:  factor<tab>feature_id

#   or

#  --genes_single_factor <string>   list of genes to test (can be a matrix, only the first column is used for gene IDs)

#

#  --GO_assignments <string>        extracted GO assignments with format: feature_id <tab> GO:000001,GO:00002,...

#

#  --lengths <string>               feature lengths file with format:  feature_id <tab> length

#

#  --background <string>            gene ids file that defines the full population of genes to consider in testing.

#                                   Ideally, these represent the genes that are expressed and relevant to this test

#                                   as opposed to using all genes in the genome.

#

###############################################################################################

>trinityrnaseq/util/misc/TPM_weighted_gene_length.py -h

usage: TPM_weighted_gene_length.py [-h] --gene_trans_map GENE_TRANS_MAP_FILE

                                   --trans_lengths TRANS_LENGTHS_FILE

                                   --TPM_matrix TPM_MATRIX_FILE [--debug]


estimates gene length as isoform lengths weighted by TPM expression values


optional arguments:

  -h, --help            show this help message and exit

  --gene_trans_map GENE_TRANS_MAP_FILE

                        gene-to-transcript mapping file, format:

                        gene_id(tab)transcript_id

  --trans_lengths TRANS_LENGTHS_FILE

                        transcript length file, format: trans_id(tab)length

  --TPM_matrix TPM_MATRIX_FILE

                        TPM expression matrix

  --debug               debug mode


実行方法

1、Trinotateの実行

trinotate.xlsを得る。


この後のステップ2-4は、ランに必要なファイルの準備になる。


2、GO DAG内のすべてのGOアサインの抽出

perl TRINOTATE/util/extract_GO_assignments_from_Trinotate_xls.pl \
--Trinotate_xls trinotate.xls \
--gene --include_ancestral_terms > go_annotations.txt
  • --gene  or --trans         gene or transcript-mode
  • --include_ancestral_terms     climbs the GO DAG, and incorporates all parent terms for an assignment.

出力

go_annotations.txt

f:id:kazumaxneo:20211227000710p:plain


3、GOseqのランに必要なfactor_labeling.txtの用意 (参考ページ1, 2)

遺伝子サブセットの名称<tab>遺伝子のリストを用意する。

diff_expressed_cond_X_Y (tab) my_gene_A 
 diff_expressed_cond_X_Y (tab) my_gene_B 
 ...
 diff_cond_W_Z (tab) my_gene_M
 diff_cond_W_Z (tab) my_gene_N

遺伝子はDEGsなどからの遺伝子ID。遺伝子サブセットの名称はユーザーが自由に決めるるが、DEGと対応した名前にする。このテキストファイルをfactor_labeling.txtという名前で保存する。


4、GOseqのランに必要なgene.lengths.txtの用意

#fasta_seq_length.plで配列の長さを取り出す。
perl trinityrnaseq/util/misc/fasta_seq_length.pl Trinity.fasta > Trinity.fasta.seq_lens

#TPM_weighted_gene_lengthのラン。DEGsのリストから配列の長さファイルを出力。各ファイルはDEG解析プロセス中で生成されているはず。
perl trinityrnaseq/util/misc/TPM_weighted_gene_length.py \
--gene_trans_map Trinity.fasta.gene_trans_map \
--trans_lengths Trinity.fasta.seq_lens \
--TPM_matrix isoforms.TMM.EXPR.matrix > Trinity.gene_lengths.txt

Trinity.gene_lengths.txtができる。これを次の5で使う。


5、GOseqのラン(機能的エンリッチメント解析)

2-4で用意したファイルを指定する。backgroundの遺伝子リストも指定する。

run_GOseq.pl --factor_labeling factor_labeling.txt \
--GO_assignments go_annotations.txt \
--lengths gene.lengths.txt --background gene_list
  • --factor_labeling   tab delimited file with format:  factor<tab>feature_id
  • --GO_assignments    extracted GO assignments with format: feature_id
  • --lengths   feature lengths file with format:  feature_id <tab> length
  • --background    gene ids file that defines the full population of genes to consider in testing.  Ideally, these represent the genes that are expressed and relevant to this test as opposed to using all genes in the genome.

出力例

f:id:kazumaxneo:20211227191829p:plain


補足

 go_annotations.txtとTrinity.gene_lengths.txtは発現変動遺伝子の解析時に指定して、発現変動遺伝子の計算と同時にGO enrichment解析を行うこともできる。それには、先日紹介したanalyze_diff_expr.plのランまでは同じ。それから、analyze_diff_expr.plのランで出来る出力ディレクトリに移動する。

それから前回とはオプションを変えてanalyze_diff_expr.plを走らせる。今回はgo_annotations.txtとTrinity.gene_lengths.txtのファイルを指定する。

run_DE_analysis.pl --matrix counts.matrix --samples_file list --method DESeq2 --dispersion 0.1
cd DESeq2xxx/

analyze_diff_expr.pl --matrix group_A_vs_group_B.DESeq2.count_matrix -P 1e-3 -C 2 --examine_GO_enrichment --GO_annots go_annotations.txt --gene_lengths Trinity.gene_lengths.txt
  •   --examine_GO_enrichment   run GO enrichment analysis
  • --GO_annots  <string>  GO annotations file
  • --gene_lengths <string>  lengths of genes file
  • --include_GOplot    optional: will generate inputs to GOplot and attempt to make a preliminary pdf plot/report for it.

有意なFDRとfold-changesを持つ転写産物と抽出し、サンプル間の発現差のパターンに従った転写物をクラスタリング、GO enrichment解析が全て実行される。

出力例

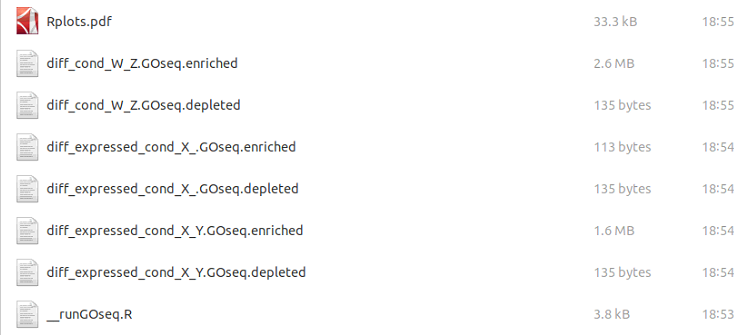
f:id:kazumaxneo:20211227221115p:plain


f:id:kazumaxneo:20211229004920p:plain

f:id:kazumaxneo:20211229004931p:plain


引用

De novo transcript sequence reconstruction from RNA-seq using the Trinity platform for reference generation and analysis

Brian J Haas, Alexie Papanicolaou, Moran Yassour, Manfred Grabherr, Philip D Blood, Joshua Bowden, Matthew Brian Couger, David Eccles, Bo Li, Matthias Lieber, Matthew D MacManes, Michael Ott, Joshua Orvis, Nathalie Pochet, Francesco Strozzi, Nathan Weeks, Rick Westerman, Thomas William, Colin N Dewey, Robert Henschel, Richard D LeDuc, Nir Friedman , Aviv Regev

Nat Protoc. 2013 Aug;8(8):1494-512


発現変動遺伝子を同定するTrinityのrun_DE_analysis.plスクリプト


Trinityに付属するスクリプトrun_DE_analysis.plを使うとBioconductorのRパッケージを使って発現変動遺伝子群を同定して分析することができる。Trinityのabundance_estimates_to_matrix.plなどを使って得た発現行列ファイルを使う


手順はTrinityのマニュアルに従っている。


インストール

ubuntu18.04でtrinityの仮想環境を作ってテストした。Rのバージョンは4.1.1。

依存

  • R
  • edgeR, limma, DESeq2, ctc, Biobase, gplots, ape, argparse

Github

mamba create -n trinity python=3.8
conda activate trinity
mamba install -c bioconda -y trinity

DEG解析に使うパッケージは前もって導入しておく
install.packages("BiocManager")
library(BiocManager)
BiocManager::install(c("edgeR", "limma", "DESeq2", "ctc", "Biobase", "gplots", "ape", "argparse"))

>  run_DE_analysis.pl

$ run_DE_analysis.pl


#################################################################################################

#

#  Required:

#

#  --matrix|m <string>               matrix of raw read counts (not normalized!)

#

#  --method <string>               edgeR|DESeq2|voom

#                                     note: you should have biological replicates.

#                                           edgeR will support having no bio replicates with

#                                           a fixed dispersion setting. 

#

#  Optional:

#

#  --samples_file|s <string>         tab-delimited text file indicating biological replicate relationships.

#                                   ex.

#                                        cond_A    cond_A_rep1

#                                        cond_A    cond_A_rep2

#                                        cond_B    cond_B_rep1

#                                        cond_B    cond_B_rep2

#

#

#  General options:

#

#  --min_reps_min_cpm  <string>    default: 2,1  (format: 'min_reps,min_cpm')

#                                  At least min count of replicates must have cpm values > min cpm value.

#                                     (ie. filtMatrix = matrix[rowSums(cpm(matrix)> min_cpm) >= min_reps, ]  adapted from edgeR manual)

#                                      Note, ** if no --samples_file, default for min_reps is set = 1 **

#

#  --output|o                      name of directory to place outputs (default: $method.$pid.dir)

#

#  --reference_sample <string>     name of a sample to which all other samples should be compared.

#                                   (default is doing all pairwise-comparisons among samples)

#

#  --contrasts <string>            file (tab-delimited) containing the pairs of sample comparisons to perform.

#                                  ex. 

#                                       cond_A    cond_B

#                                       cond_Y    cond_Z

#

#

###############################################################################################

#

#  ## EdgeR-related parameters

#  ## (no biological replicates)

#

#  --dispersion <float>            edgeR dispersion value (Read edgeR manual to guide your value choice)

#                                    http://www.bioconductor.org/packages/release/bioc/html/edgeR.html

#

###############################################################################################

#

#   Documentation and manuals for various DE methods.  Please read for more advanced and more

#   fine-tuned DE analysis than provided by this helper script.

#

#  edgeR:       http://www.bioconductor.org/packages/release/bioc/html/edgeR.html

#  DESeq2:      http://bioconductor.org/packages/release/bioc/html/DESeq2.html    

#  voom/limma:  http://bioconductor.org/packages/release/bioc/html/limma.html

#

###############################################################################################


> Glimma.Trinity.Rscript-h

Warning message:

package ‘argparse’ was built under R version 4.1.2 

usage: Glimma.Trinity.Rscript

       [-h] --samples_file SAMPLES_FILE --DE_results DE_RESULTS

       --counts_matrix COUNTS_MATRIX


optional arguments:

  -h, --help            show this help message and exit

  --samples_file SAMPLES_FILE

                        samples file

  --DE_results DE_RESULTS

                        DE_results file

  --counts_matrix COUNTS_MATRIX

                        matrix of raw counts

>  analyze_diff_expr.pl

#################################################################################### 

#

# Required:

#

#  --matrix|m <string>       TMM.EXPR.matrix

#

# Optional:

#

#  -P <float>             p-value cutoff for FDR  (default: 0.001)

#  -C <float>             min abs(log2(a/b)) fold change (default: 2  (meaning 2^(2) or 4-fold).

#

#  --output <float>       prefix for output file (default: "diffExpr.P${Pvalue}_C${C})

#

#

#

#

# Misc:

#

#  --samples|s <string>                     sample-to-replicate mappings (provided to run_DE_analysis.pl)

#

#  --max_DE_genes_per_comparison <int>    extract only up to the top number of DE features within each pairwise comparison.

#                                         This is useful when you have massive numbers of DE features but still want to make

#                                         useful heatmaps and other plots with more manageable numbers of data points.

#

#  --order_columns_by_samples_file        instead of clustering samples or replicates hierarchically based on gene expression patterns,

#                                         order columns according to order in the --samples file.

#

#  --max_genes_clust <int>                default: 10000  (if more than that, heatmaps are not generated, since too time consuming)

#

#  --examine_GO_enrichment                run GO enrichment analysis

#       --GO_annots <string>              GO annotations file

#       --gene_lengths <string>           lengths of genes file

#

#       --include_GOplot                  optional: will generate inputs to GOplot and attempt to make a preliminary pdf plot/report for it.

#

##############################################################

> define_clusters_by_cutting_tree.pl

###################################################################################

#

# -K <int>          define K clusters via k-means algorithm

#

#  or, cut the hierarchical tree:

#

# --Ktree <int>     cut tree into K clusters

#

# --Ptree <float>   cut tree based on this percent of max(height) of tree 

#

# -R <string>  the filename for the store RData (file.all.RData)

#

#  misc:

#

#   --lexical_column_ordering       reorder column names according to lexical ordering

#   --no_column_reordering  

#

###################################################################################

> trinityrnaseq/Analysis/DifferentialExpression/rename_matrix_feature_identifiers.pl

###############################################

#  Usage: trinityrnaseq/Analysis/DifferentialExpression/rename_matrix_feature_identifiers.pl matrix.txt  new_feature_id_mapping.txt

#

#  The 'new_feature_id_mapping.txt' file has the format:

#

#   current_identifier <tab> new_identifier

#   ....

#

#

#   Only those entries with new names listed will be updated, the rest stay unchanged.

#

#

#################################################


実行方法

1、全サンプルの全リードを結合し、単一のトリニティアセンブリを生成する(各サンプルごとにアセンブルすると比較が困難になる)。


2、昨日紹介した方法でGeneまたはTranscriptsの発現行列のファイルを得る(salmonが一番高速)。(このあと、3以降の前に6をランするとアノテーションを付けられる)


3、run_DE_analysis.plのラン

run_DE_analysis.plのランには、サンプルとの関係を示したリストファイルが必要。そのファイルを"--samples_file <list>"で指定する。run_DE_analysis.plはリストファイルからサンプルのreplicatesを判断してRNAseqのデータを比較する。

リストファイルは、サンプルグループ名<tab>反復名のタブ区切りファイル。

cond_A    cond_A_rep1
cond_A    cond_A_rep2
cond_B    cond_B_rep1
cond_B    cond_B_rep2

このリストファイルを指定する。ここではDEseq2を使う。このコマンドで各遺伝子のlog fold change、P値、FDRが計算される。

run_DE_analysis.pl --matrix counts.matrix --samples_file list --method DESeq2 --dispersion 0.1
  • --method <string>   edgeR|DESeq2|voom
     note: you should have biological replicates.edgeR will support having no bio replicates with  a fixed dispersion setting.
  • --dispersion <float>   edgeR dispersion value (Read edgeR manual to guide your value choice)
  • --samples_file  <string>   tab-delimited text file indicating biological replicate relationships.

デフォルトでは、各サンプルグループ間の比較が実行される。ペアごとの比較を制限したい場合は、--contrastsパラメータに実行する比較のリストを指定する(マニュアル参照)。


出力例

f:id:kazumaxneo:20211226192201p:plain

group_A_vs_group_B.voom.DE_results

f:id:kazumaxneo:20211226212956p:plain

geneID, logFC, logCPM, PValue, FDRの5列。このファイルには全遺伝子表示されている。

group_A_vs_group_B.edgeR.DE_results.MA_n_Volcano.pdf

f:id:kazumaxneo:20211226213652p:plain

f:id:kazumaxneo:20211226213704p:plain

FDR <0.05が赤になっている。ここでは正しい複製をつかっていないのでFDR <0.05を満たす遺伝子はほぼない。


4、analyze_diff_expr.plのラン

有意なFDRとfold-changesを持つ転写産物を抽出し、サンプル間の発現差のパターンに従って転写物をクラスタリングする。analyze_diff_expr.plをランには、まずDEseq2|edgeR|limmaの出力ディレクトリ内に入り、以下のように実行する。DEseq2|edgeR|limmaの出力ディレクトリ内にある~.count_matrixファイルを指定する。

cd DEseq2/
analyze_diff_expr.pl --matrix group_A_vs_group_B.DESeq2.count_matrix -P 1e-3 -C 2

P値が最大1e-3、少なくとも2^2倍の発現変動がある遺伝子が抽出される。

出力例

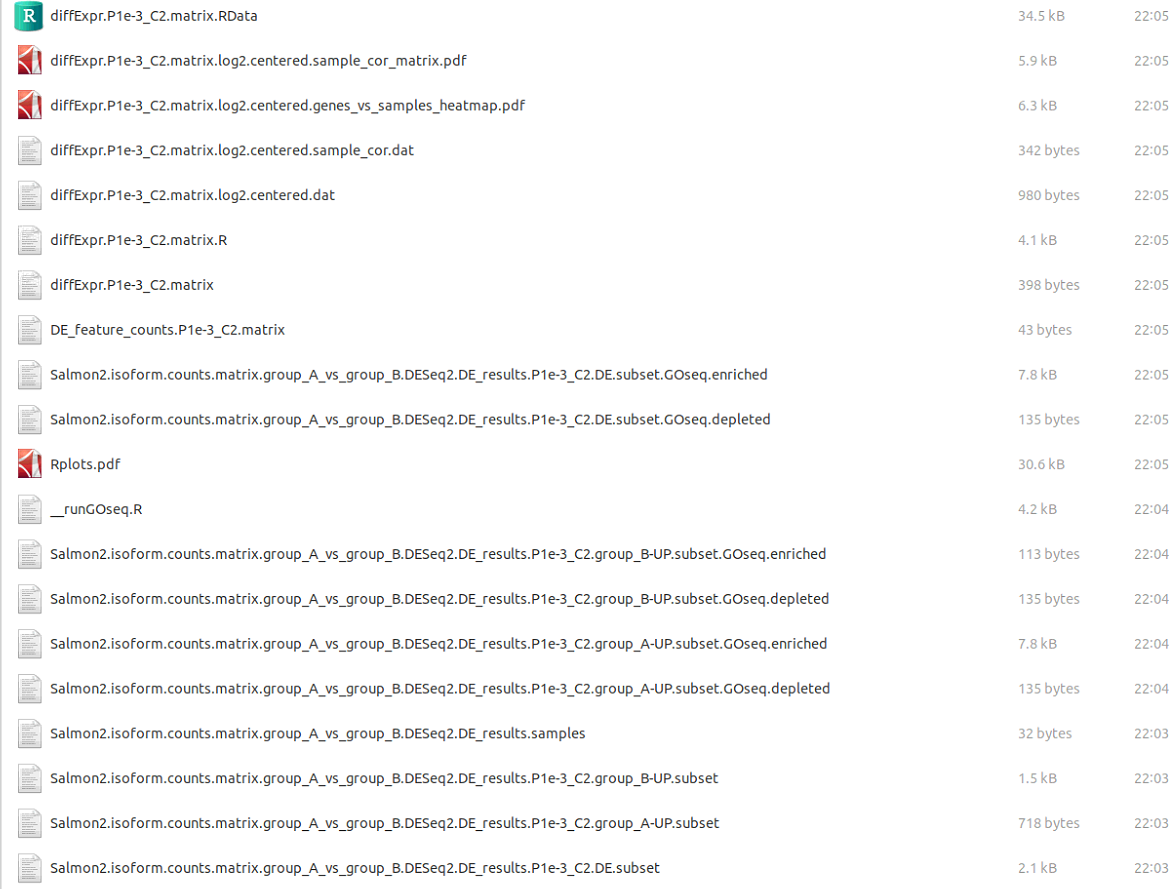
f:id:kazumaxneo:20211226214718p:plain

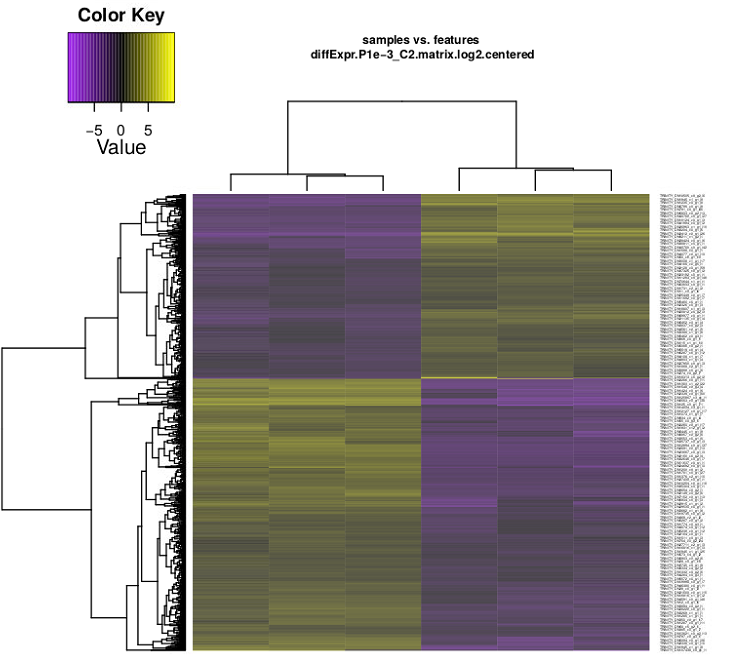
A_vs_group_B.DESeq2.DE_results.P1e-3_C2.group_A-UP.subsetはグループAで誘導された遺伝子、A_vs_group_B.DESeq2.DE_results.P1e-3_C2.group_B-UP.subsetはグループBで誘導された遺伝子。他にもサンプル間のペアワイズ相関行列ヒートマップが出力される。

Trinotateアノテーションがあれば、4のランと同時にGO enrichmet解析も実行できる(別記事の一番下)。


5、define_clusters_by_cutting_tree.plのラン

より本格的に遺伝子クラスターを定義するために、ヒートマップで示されたDEGsを、類似の発現パターンを持つ遺伝子クラスターに分割する。ランに必要なデータはすべてRセッションで、ローカルに 'all.RData' というファイルとして保存されているので、これをdefine_clusters_by_cutting_tree.plのコマンドで指定する。階層的にクラスタ化された遺伝子ツリーを ”--Ptree %”の高さで切断する。もしくはK-means clustering を用いて。(-Kパラメータを使用)、K 個の遺伝子クラスターセットを定義する。

define_clusters_by_cutting_tree.pl -R diffExpr.P1e-3_C2.matrix.RData --Ptree 60
  • -R <string>  the filename for the store RData (file.all.RData)
  • --Ptree <float>   cut tree based on this percent of max(height) of tree
  • --Ktree <int>    cut tree into K clusters

ランが終わると、DEseq2|edgeR|limmaの出力ディレクトリ内にさらにディレクトリができ、その中にファイルが保存される。


出力例

f:id:kazumaxneo:20211226215248p:plain

クラスタの発現行列(log2変換、中央値中心)と下の図が保存される。

my_cluster_plots.pdf

f:id:kazumaxneo:20211226215301p:plain

各遺伝子は、そのクラスタの平均発現プロファイル(青)に加えて(灰)プロットされる。ここでのテストには正しくない複製を使っており、灰色の線(DEGs)の数は極端に少ない。


6、Trinotateの機能的アノテーションの追加

Trinotate(Trinityの開発者Brian Haasが開発・管理)をランしてトランスクリプトームの機能的アノテーションを付けた場合、機能アノテーション情報をDEGsのマトリックスに追加してGO enrichment解析を実行したりできる。

まずTrinotate.xls のアノテーションファイルをアノテーションマッピングファイルに変換する。

git clone https://github.com/Trinotate/Trinotate.git
perl Trinotate/util/Trinotate_get_feature_name_encoding_attributes.pl Trinotate.xls > Trinotate_report.xls.name_mappings

Trinotate.xlsが複数あるなら複数回ランして出力をcatで結合する。

Trinotate_report.xls.name_mappings (マニュアル)

f:id:kazumaxneo:20211226223623p:plain

次に、これらの新しい機能アノテーションを発現行列に組み込む。DEGsのリストでも元の発現行列でも組み込める。

perl trinityrnaseq/Analysis/DifferentialExpression/rename_matrix_feature_identifiers.pl \
Trinity_trans.TMM.EXPR.matrix Trinotate_report.xls.name_mappings  > Trinity_trans.TMM.EXPR.annotated.matrix

転写産物(または遺伝子)識別子と一緒に簡単なアノテーション文字列が付けられる。これは、下流のすべての発現解析に反映される。例えば、ヒートマップやMA plotなどで視覚化した時にも表示されるので、前もってランしておいてもよいかもしれない。


Trinityのマニュアルでは、転写産物または遺伝子識別子に機能的な注釈をつけたあと、TM4 MeVアプリケーションに読み込んで、解析する例が書かれています。TM4 MeVアプリケーションは、マイクロアレイやRNA-Seqデータから得られる発現データをナビゲートするためのデスクトップアプリケーションです。使い方についても解説されています(リンク)。

引用

De novo transcript sequence reconstruction from RNA-seq using the Trinity platform for reference generation and analysis

Brian J Haas, Alexie Papanicolaou, Moran Yassour, Manfred Grabherr, Philip D Blood, Joshua Bowden, Matthew Brian Couger, David Eccles, Bo Li, Matthias Lieber, Matthew D MacManes, Michael Ott, Joshua Orvis, Nathalie Pochet, Francesco Strozzi, Nathan Weeks, Rick Westerman, Thomas William, Colin N Dewey, Robert Henschel, Richard D LeDuc, Nir Friedman , Aviv Regev

Nat Protoc. 2013 Aug;8(8):1494-512


関連


Biological replicatesの品質を調べるためのTrinityのPtRスクリプト


Trinityに付属するスクリプトPtRは、生物学的複製が十分に相関していることを確認し、またサンプル間の関係を調査するためのユーティリティツールである。Trinityのabundance_estimates_to_matrix.plなどを使って得た発現量の行列ファイルを使うTrinityのマニュアルに習い、使い方を確認しておく。


インストール

ubuntu18.04でtrinityの仮想環境を作ってテストした。Rのバージョンは4.1.1。

依存

  • R

Github

mamba create -n trinity python=3.8
conda activate trinity
mamba install -c bioconda -y trinity

> PtR 

#################################################################################### 

#

#######################

# Inputs and Outputs: #

#######################

#

#  --matrix <string>        matrix.RAW.normalized.FPKM

#

#  Optional:

#

#  Sample groupings:

#

#  --samples <string>      tab-delimited text file indicating biological replicate relationships.

#                                   ex.

#                                        cond_A    cond_A_rep1

#                                        cond_A    cond_A_rep2

#                                        cond_B    cond_B_rep1

#                                        cond_B    cond_B_rep2

#

#  --gene_factors <string>   tab-delimited file containing gene-to-factor relationships.

#                               ex.

#                                    liver_enriched <tab> gene1

#                                    heart_enriched <tab> gene2

#                                    ...

#                            (use of this data in plotting is noted for corresponding plotting options)

#

#

#  --output <string>        prefix for output file (default: "${matrix_file}.heatmap")

#

#  --save                   save R session (as .RData file)

#  --no_reuse               do not reuse any existing .RData file on initial loading

#

#####################

#  Plotting Actions #

#####################

#

#  --compare_replicates        provide scatter, MA, QQ, and correlation plots to compare replicates.

#

#   

#

#  --barplot_sum_counts        generate a barplot that sums frag counts per replicate across all samples.

#

#  --boxplot_log2_dist <float>        generate a boxplot showing the log2 dist of counts where counts >= min fpkm

#

#  --sample_cor_matrix         generate a sample correlation matrix plot

#    --sample_cor_scale_limits <string>    ex. "-0.2,0.6"

#    --sample_cor_sum_gene_factor_expr <factor=string>    instead of plotting the correlation value, plot the sum of expr according to gene factor

#                                                         requires --gene_factors 

#

#  --sample_cor_subset_matrix <string>  plot the sample correlation matrix, but create a disjoint set for rows,cols.

#                                       The subset of the samples to provide as the columns is provided as parameter.

#

#  --gene_cor_matrix           generate a gene-level correlation matrix plot

#

#  --indiv_gene_cor <string>   generate a correlation matrix and heatmaps for '--top_cor_gene_count' to specified genes (comma-delimited list)

#      --top_cor_gene_count <int>   (requires '--indiv_gene_cor with gene identifier specified')

#      --min_gene_cor_val <float>   (requires '--indiv_gene_cor with gene identifier specified')

#

#  --heatmap                   genes vs. samples heatmap plot

#      --heatmap_scale_limits "<int,int>"  cap scale intensity to low,high  (ie.  "-5,5")

#      --heatmap_colorscheme <string>  default is 'purple,black,yellow'

#                                      a popular alternative is 'green,black,red'

#                                      Specify a two-color gradient like so: "black,yellow".

#

#     # sample (column) labeling order

#      --lexical_column_ordering        order samples by column name lexical order.

#      --specified_column_ordering <string>  comma-delimited list of column names (must match matrix exactly!)

#      --order_columns_by_samples_file  order the columns in the heatmap according to replicate name ordering in the samples file.

#

#     # gene (row) labeling order

#      --order_by_gene_factor           order the genes by their factor (given --gene_factors)

#

#  --gene_heatmaps <string>    generate heatmaps for just one or more specified genes

#                              Requires a comma-delimited list of gene identifiers.

#                              Plots one heatmap containing all specified genes, then separate heatmaps for each gene.

#                                 if --gene_factors set, will include factor annotations as color panel.

#                                 else if --prin_comp set, will include include principal component color panel.

#

#  --prin_comp <int>           generate principal components, include <int> top components in heatmap  

#      --add_prin_comp_heatmaps <int>  draw heatmaps for the top <int> features at each end of the prin. comp. axis.

#                                      (requires '--prin_comp') 

#      --add_top_loadings_pc_heatmap <int>  draw a heatmap containing the <int> top feature loadings across all PCs.

#      --R_prin_comp_method <string>        options: princomp, prcomp (default: prcomp)

#

#  --mean_vs_sd               expression variability plot. (highlight specific genes by category via --gene_factors )

#

#  --var_vs_count_hist <vartype=string>        create histogram of counts of samples having feature expressed within a given expression bin.

#                                              vartype can be any of 'sd|var|cv|fano'

#      --count_hist_num_bins <int>  number of bins to distribute counts in the histogram (default: 10)

#      --count_hist_max_expr <float>  maximum value for the expression histogram (default: max(data))

#      --count_hist_convert_percentages       convert the histogram counts to percentage values.

#

#

#  --per_gene_plots                   plot each gene as a separate expression plot (barplot or lineplot)

#    --per_gene_plot_width <float>     default: 2.5

#    --per_gene_plot_height <float>    default: 2.5

#    --per_gene_plots_per_row <int>   default: 1

#    --per_gene_plots_per_col <int>   default: 2

#    --per_gene_plots_incl_vioplot    include violin plots to show distribution of rep vals

#

########################################################

#  Data Filtering, in order of operation below:  #########################################################

#

#

## Column filters:

#

#  --restrict_samples <string>   comma-delimited list of samples to restrict to (comma-delim list)

#

#  --top_rows <int>         only include the top number of rows in the matrix, as ordered.

#

#  --min_colSums <float>      min number of fragments, default: 0

#

#  --min_expressed_genes <int>           minimum number of genes (rows) for a column (replicate) having at least '--min_gene_expr_val'

#       --min_gene_expr_val <float>   a gene must be at least this value expressed across all samples.  (default: 1)

#

#

## Row Filters:

#

#  --min_rowSums <float>      min number of fragments, default: 0

#

#  --gene_grep <string>     grep on string to restrict to genes

#

#  --min_across_ALL_samples_gene_expr_val <int>   a gene must have this minimum expression value across ALL samples to be retained.

#

#  --min_across_ANY_samples_gene_expr_val <int>   a gene must have at least this expression value across ANY single sample to be retained.

#

#  --min_gene_prevalence <int>   gene must be found expressed in at least this number of columns

#       --min_gene_expr_val <float>   a gene must be at least this value expressed across all samples.  (default: 1)

#

#  --minValAltNA <float>    minimum cell value after above transformations, otherwise convert to NA

#

#  --top_genes <int>        use only the top number of most highly expressed transcripts

#

#  --top_variable_genes <int>      Restrict to the those genes with highest coeff. of variability across samples (use median of replicates)

#

#      --var_gene_method <string>   method for ranking top variable genes ( 'coeffvar|anova', default: 'anova' )

#           --anova_maxFDR <float>    if anova chose, require FDR value <= anova_maxFDR  (default: 0.05)

#            or

#           --anova_maxP <float>    if set, over-rides anova_maxQ  (default, off, uses --anova_maxQ)

#

#  --top_variable_via_stdev_and_mean_expr    perform filtering based on the stdev vs. mean expression plot.

#      Requires both:               (note, if you used --log2 and/or --Zscale, settings below should use those transformed values)

#         --min_stdev_expr <float>       minimum standard deviation in expression

#         --min_mean_expr  <float>       minimum mean expression value 

#

######################################

#  Data transformations:             #

######################################

#

#  --CPM                    convert to counts per million (uses sum of totals before filtering)

#  --CPK                    convert to counts per thousand

#

#  --binary                 all values > 0 are set to 1.  All values < 0 are set to zero.

#

#  --log2

#

#  --center_rows            subtract row mean from each data point. (only used under '--heatmap' )

#

#  --Zscale_rows            Z-scale the values across the rows (genes)  

#

#########################

#  Clustering methods:  #

#########################

#

#  --gene_dist <string>        Setting used for --heatmap (samples vs. genes)

#                                  Options: euclidean, gene_cor

#                                           maximum, manhattan, canberra, binary, minkowski

#                                  (default: 'euclidean')  Note: if using 'gene_cor', set method using '--gene_cor' below.

#

#

#  --sample_dist <string>      Setting used for --heatmap (samples vs. genes)

#                                  Options: euclidean, sample_cor

#                                           maximum, manhattan, canberra, binary, minkowski

#                                  (default: 'euclidean')  Note: if using 'sample_cor', set method using '--sample_cor' below.

#

#

#  --gene_clust <string>       ward, single, complete, average, mcquitty, median, centroid, none (default: complete)

#  --sample_clust <string>     ward, single, complete, average, mcquitty, median, centroid, none (default: complete)

#

#  --gene_cor <string>             Options: pearson, spearman  (default: pearson)

#  --sample_cor <string>           Options: pearson, spearman  (default: pearson)

#

####################

#  Image settings: #

####################

#

#

#  --imgfmt <string>           image type (pdf,svg) with default: pdf

#

#  --img_width <int>           image width

#  --img_height <int>          image height

#

################

# Misc. params #

################

#

#  --write_intermediate_data_tables         writes out the data table after each transformation.

#

#  --show_pipeline_flowchart                describe order of events and exit.

#

####################################################################################


実行方法

1、昨日紹介した方法で発現行列のファイルを得る。


2、PtRのラン

PtRのランには、サンプルとの関係を示したリストファイルが必要。そのファイルを"--samples <list>"で指定する。PtRはリストファイルからサンプルのreplicatesを判断してRNAseqのデータを比較する。

リストファイルは、サンプルグループ名<tab>反復名のタブ区切りファイル。

cond_A    cond_A_rep1
cond_A    cond_A_rep2
cond_B    cond_B_rep1
cond_B    cond_B_rep2

このリストファイルを指定する。replicates比較なら”--compare_replicates”を付ける。Count Per Milion (CPM) に変換してから比較するなら”--CPM”を付ける。log2で比較するなら ”--log2”を付ける。 

/PtR --matrix counts.matrix --samples list --log2 --CPM \
--min_rowSums 10 --compare_replicates --barplot_sum_counts
  • --compare_replicates    provide scatter, MA, QQ, and correlation plots to compare replicates.
  • --CPM    convert to counts per million (uses sum of totals before filtering)
  • --min_rowSums    min number of fragments, default: 0

出力例

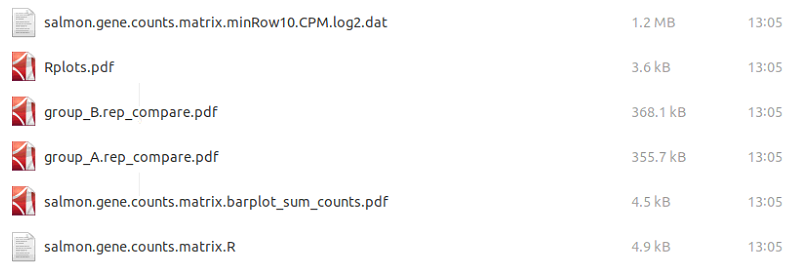
f:id:kazumaxneo:20211226130542p:plain

group_A.rep_compare.pdf(同じ条件のreplicates間での比較)

f:id:kazumaxneo:20211226130402p:plain

注;ここでは複製ではないサンプルを使用


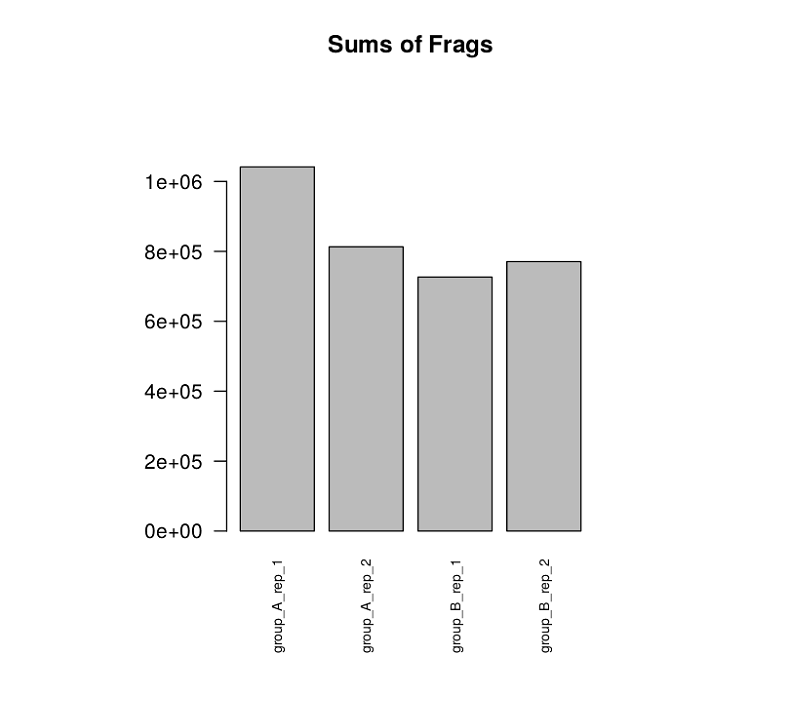
salmon.gene.counts.matrix.barplot_sum_counts.pdf

f:id:kazumaxneo:20211226130736p:plain

"--barplot_sum_counts”を付けたときに出力される全サンプルのバープロット)


続いて全サンプルを比較するために相関行列のヒートマップを出力。”--compare_replicates”を外し、”--sample_cor_matrix”を指定する。

PtR --matrix counts.matrix --samples list --log2 --CPM \
--min_rowSums 10 --sample_cor_matrix
  • --sample_cor_matrix      generate a sample correlation matrix plot

全サンプルのペアワイズ相関行列のヒートマップが出力される。


複製間の関係を探るため主成分分析 (PCA) を行う。

PtR --matrix counts.matrix --samples list --log2 --CPM \
--min_rowSums 10 --center_rows --prin_comp 3
  • --prin_comp <int>  generate principal components, include <int> top components in heatmap


他にもヒートマップを描く”--heatmap”などがあります。オプションを確認して下さい。

引用

De novo transcript sequence reconstruction from RNA-seq using the Trinity platform for reference generation and analysis

Brian J Haas, Alexie Papanicolaou, Moran Yassour, Manfred Grabherr, Philip D Blood, Joshua Bowden, Matthew Brian Couger, David Eccles, Bo Li, Matthias Lieber, Matthew D MacManes, Michael Ott, Joshua Orvis, Nathalie Pochet, Francesco Strozzi, Nathan Weeks, Rick Westerman, Thomas William, Colin N Dewey, Robert Henschel, Richard D LeDuc, Nir Friedman , Aviv Regev

Nat Protoc. 2013 Aug;8(8):1494-512

Trinityのabundance_estimates_to_matrix.plスクリプトで発現行列を出力、filter_low_expr_transcripts.plスクリプトで低発現転写産物をフィルタリングする


Trinityに付属するスクリプトabundance_estimates_to_matrix.plは、align_and_estimate_abundance.plの出力を入力として、複数サンプルを(正規化しつつ)統合した発現行列ファイルを生成するスクリプトTrinityのマニュアルに習い、使い方を確認しておく。


インストール

ubuntu18.04LTSでcondaの仮想環境を作ってテストした。

Github

mamba create -n trinity python=3.8
conda activate trinity
mamba install -c bioconda -y trinity

#salmon
mamba install -c bioconda -y salmon

> abundance_estimates_to_matrix.pl -h

$ abundance_estimates_to_matrix.pl -h


####################################################################################

#

# Usage:  /home/kazu/mambaforge/envs/trinity/bin/abundance_estimates_to_matrix.pl

--est_method <method>  sample1.results sample2.results ...

#

#      or  /home/kazu/mambaforge/envs/trinity/bin/abundance_estimates_to_matrix.pl

--est_method <method> --quant_files file.listing_target_files.txt

#

#      Note, if only a single input file is given, it's expected to

contain the paths to all the target abundance estimation files.

#

# Required:

#

#  --est_method <string>           RSEM|eXpress|kallisto|salmon

(needs to know what format to expect)

#

#  --gene_trans_map <string>           the gene-to-transcript mapping

file. (if you don't want gene estimates, indicate 'none'.

#

#

# Options:

#

#  --cross_sample_norm <string>         TMM|UpperQuartile|none   (default: TMM)

#

#  --name_sample_by_basedir             name sample column by dirname

instead of filename

#      --basedir_index <int>            default(-2)

#

#  --out_prefix <string>                default: value for --est_method

#

#  --quant_files <string>              file containing a list of all

the target files.

#

######################################################################################

> filter_low_expr_transcripts.pl 

##########################################################################################

#

#  --matrix|m <string>            expression matrix (TPM or FPKM, *not* raw counts)

#

#  --transcripts|t <string>       transcripts fasta file (eg. Trinity.fasta)

#

#

#  # expression level filter:

#

#     --min_expr_any <float>      minimum expression level required across any sample (default: 0)

#

#  # Isoform-level filtering

#

#     --min_pct_dom_iso <int>         minimum percent of dominant isoform expression (default: 0)

#          or

#     --highest_iso_only          only retain the most highly expressed isoform per gene (default: off)

#                                 (mutually exclusive with --min_pct_dom_iso param)

#

#     # requires gene-to-transcript mappings

#

#     --trinity_mode              targets are Trinity-assembled transcripts

#         or

#     --gene_to_trans_map <string>   file containing gene-to-transcript mappings

#                                    (format is:   gene(tab)transcript )

#

#########################################################################################


実行方法

1、Trinityのアセンブリにfastqを当てて定量する。Trinityのスクリプトalign_and_estimate_abundance.plを使う。

align_and_estimate_abundance.plのランではfastqを指定するが、複数条件かつレプリケートがある時は、fastqのパスを指定せずにfastqとサンプルとの関係を示したリストファイルを作り、そのファイルを"--samples_file <list>"で指定する。こうすると、サンプル関係を考慮して一度に全ての結果を出力してくれる。

リストファイルは、サンプルグループ名<tab>反復名<tab>ペアエンドR1<tab>ペアエンドR2、のタブ区切りファイルで書く(シングルエンドなら4列目は不要)。

cond_A    cond_A_rep1    A_rep1_left.fq    A_rep1_right.fq
cond_A    cond_A_rep2    A_rep2_left.fq    A_rep2_right.fq
cond_B    cond_B_rep1    B_rep1_left.fq    B_rep1_right.fq
cond_B    cond_B_rep2    B_rep2_left.fq    B_rep2_right.fq


このリストファイルを指定する。strand ppecificなら--SS_lib_typeでペアエンドの向きを指定する(FRとRF)。ここでは高速なsalmonを使う。(salmonのエラーが出た時はsalmonを最新版にアップデートしたら治る可能性がある;mamba remove salmon -y && mamba install -c bioconda -y salmon)。

align_and_estimate_abundance.pl --transcripts Trinity.fasta \
--seqType fq --samples_file list --est_method salmon \
--trinity_mode --prep_reference --thread_count 30 \
--output_dir RSEM_outdir --SS_lib_type FR

サンプルごとに出力される。

f:id:kazumaxneo:20211225180020p:plain

ディレクトリ内にあるquant.sf(transcript level)かquant.sf.gene(gene level)をステップ2で使う。


2、結果を統合する。各ディレクトリ内にあるquant.sfを指定する。.gene_trans_mapは1のランで出来ているので、それを使う。

abundance_estimates_to_matrix.pl --est_method salmon --gene_trans_map \
Trinity.fasta.gene_trans_map --out_prefix salmon --name_sample_by_basedir \
group_A_rep_1/quant.sf group_A_rep_2/quant.sf \
group_B_rep_1/quant.sf group_B_rep_2/quant.sf
  • --est_method    RSEM|eXpress|kallisto|salmon
  • --gene_trans_map     the gene-to-transcript mapping
  • --cross_sample_norm    TMM|UpperQuartile|none   (default: TMM)

出力例

f:id:kazumaxneo:20211225212317p:plain

TMM正規化、TPM正規化、rawのそれぞれのカウントマトリックスが出力される。


3、得られたTPMの発現行列を使い、TPMの発現量分布を調べる。

git clone https://github.com/trinityrnaseq/trinityrnaseq.git
perl /trinityrnaseq/util/misc/count_matrix_features_given_MIN_TPM_threshold.pl \
genes_matrix.TPM.not_cross_norm | tee genes_matrix.TPM.not_cross_norm.counts_by_min_TPM

たくさんのサンプルの中で、少なくともxxxのTPM値で発現している遺伝子がいくつあるか表示される。例えば全てのサンプルでTPM1以下の転写産物を除くなどの判断に使える。

視覚化する。

R
> data = read.table("genes_matrix.TPM.not_cross_norm.counts_by_min_TPM", header=T)
> plot(data, xlim=c(-100,0), ylim=c(0,100000), t='b')

f:id:kazumaxneo:20211225230729p:plain

発現量のNx統計を計算するスクリプトも用意されている(マニュアル)。


4、転写産物をフィルタリングして低発現のものを除外する。ここではTPMが全てのサンプルで1以下を除外。

filter_low_expr_transcripts.pl --matrix Salmon.isoform.TPM.not_cross_norm --transcripts Trinity.fasta --min_expr_any 1 --gene_to_trans_map --trinity_mode

発現量値のみに基づいて転写物をフィルタリングすることは、生物学的に関連する転写物をデータから簡単に破棄することになるので、注意が必要。理想的には、発現値と機能アノテーションデータの組み合わせを考慮したフィルタリングが必要(マニュアルより)。


引用

De novo transcript sequence reconstruction from RNA-seq using the Trinity platform for reference generation and analysis

Brian J Haas, Alexie Papanicolaou, Moran Yassour, Manfred Grabherr, Philip D Blood, Joshua Bowden, Matthew Brian Couger, David Eccles, Bo Li, Matthias Lieber, Matthew D MacManes, Michael Ott, Joshua Orvis, Nathalie Pochet, Francesco Strozzi, Nathan Weeks, Rick Westerman, Thomas William, Colin N Dewey, Robert Henschel, Richard D LeDuc, Nir Friedman , Aviv Regev

Nat Protoc. 2013 Aug;8(8):1494-512


関連


参考

quant.sfを使う。