2020 2/29 誤字修正
クラスターヒートマップは、高次元のデータを視覚化するための一般的なグラフィカルな方法である。その中で、数値のテーブルは、色付きセルのタイル状のマトリックスとしてスケーリングおよびエンコードされる。マトリックスの行と列は、パターンを強調するように順序付けられており、よく樹形図とカテゴリー注釈の追加の列を伴う。 1世紀以上にわたるこの象徴的な視覚化の継続的な開発は、すべてのバイオインフォマティクスディスプレイの中で最も広く使用されているディスプレイ方法の1つの基盤を提供している(Wilkinson and Friendly、2009)。統計計算にR言語を使用する場合(R Core Team、2016)、静的なヒートマップを作成するための多くのパッケージが存在する。たとえば、stats、gplots、heatmap3、fheatmap、pheatmapなどである。最近リリースされたパッケージでは、より複雑なレイアウトも可能である。これらには、gapma、 superheat、およびComplexHeatmapが含まれる(Gu et al、2016)。次の進化のステップは、インタラクティブなクラスターヒートマップの作成であり、いくつかのソリューションが既に利用可能である。ただし、idendro Rパッケージ(Sieger et al、2017)などのこれらのソリューションは、多くの場合、研究者のパーソナルコンピューターでのみ探索できるインタラクティブな出力を提供することに焦点を当てている。共有可能なインタラクティブヒートマップを作成するためのソリューションがいくつかある。ただし、これらはXCMS Onlineなどの特定のオンラインプロバイダーに依存しているか、InCHlibなどのJavaScriptの知識が必要である。実際には、学術雑誌に掲載する場合、読者には静的な数字のみが残される(多くの場合、pngまたはpdf形式)。
このギャップを埋めるために、インタラクティブなクラスターヒートマップを含む共有可能なHTMLファイルを簡単に作成するためのheatmaply Rパッケージを開発した。対話機能は、次のコマンドを実行した後、ユーザーのデータに基づいて生成されるクライアント側のJavaScriptコードに基づいている。
HTMLファイルには、ユーザーがセルの上にマウスを移動したときに値を表示できるだけでなく、ズームインできるようにする、出版用のインタラクティブな図が含まれている。この自己完結型のHTMLファイルは、研究者のホームページにアップロードするか、雑誌のサーバーの補足資料として興味のある読者が利用できるようにすることができる。同時に、このインタラクティブな図は、RStudioのビューアペインに表示したり、Shinyアプリケーションに含めたり、knitr / RMarkdown HTMLドキュメントに埋め込むことができる。
このペーパーの残りの部分では、効果的なクラスターヒートマップ視覚化を作成するためのガイドラインを提供する。論文図1は、プロジェクトTychoのデータに関するこのセクションの提案を示している(van Panhuis et al、2013)。オンラインの補足資料には、インタラクティブなバージョンと、実世界の生物学データでのパッケージの使用例が含まれている。
CRAN manual
https://cran.r-project.org/web/packages/heatmaply/heatmaply.pdf
インストール
macos10.14のRstudioを使ってテストした。
依存
- Depends R (>= 3.0.0), plotly (>= 4.7.1), viridis
Imports ggplot2 (>= 2.2.0), dendextend (>= 1.12.0), magrittr (>= 1.0.1), reshape2, scales, seriation, utils, stats, grDevices, methods, colorspace, RColorBrewer, htmlwidgets, webshot, assertthat, egg
#CRAN
> install.packages('heatmaply')
>help(heatmaply)
heatmaply package:heatmaply R Documentation
Cluster heatmap based on plotly
Description:
An object of class heatmapr includes all the needed information
for producing a heatmap. The goal is to separate the
pre-processing of the heatmap elements from the graphical
rendering of the object, which could be done
(Please submit an issue on github if you have a feature that you
wish to have added)
heatmaply_na is a wrapper for `heatmaply` which comes with
defaults that are better for exploring missing value (NA)
patterns. Specifically, the grid_gap is set to 1, and the colors
include two shades of grey. It also calculates the is.na10
automatically.
heatmaply_cor is a wrapper for `heatmaply` which comes with
defaults that are better for correlation matrixes. Specifically,
the limits are set from -1 to 1, and the color palette is RdBu.
Usage:
heatmaply(x, ...)
heatmaply_na(x, grid_gap = 1, colors = c("grey80", "grey20"), ...)
heatmaply_cor(x, limits = c(-1, 1), colors = cool_warm, ...)
## Default S3 method:
heatmaply(
x,
colors = viridis(n = 256, alpha = 1, begin = 0, end = 1, option = "viridis"),
limits = NULL,
na.value = "grey50",
row_text_angle = 0,
column_text_angle = 45,
subplot_margin = 0,
cellnote = NULL,
draw_cellnote = !is.null(cellnote),
cellnote_color = "auto",
cellnote_textposition = "middle right",
cellnote_size = 12,
Rowv,
Colv,
distfun = dist,
hclustfun = hclust,
dist_method = NULL,
hclust_method = NULL,
distfun_row,
hclustfun_row,
distfun_col,
hclustfun_col,
dendrogram = c("both", "row", "column", "none"),
show_dendrogram = c(TRUE, TRUE),
reorderfun = function(d, w) reorder(d, w),
k_row = 1,
k_col = 1,
symm = FALSE,
revC,
scale = c("none", "row", "column"),
na.rm = TRUE,
row_dend_left = FALSE,
margins = c(NA, NA, NA, NA),
...,
scale_fill_gradient_fun = NULL,
grid_color = NA,
grid_gap = 0,
srtRow,
srtCol,
xlab = "",
ylab = "",
main = "",
titleX = TRUE,
titleY = TRUE,
hide_colorbar = FALSE,
key.title = NULL,
return_ppxpy = FALSE,
row_side_colors,
row_side_palette = NULL,
col_side_colors,
col_side_palette = NULL,
ColSideColors = NULL,
RowSideColors = NULL,
seriate = c("OLO", "mean", "none", "GW"),
heatmap_layers = NULL,
side_color_layers = NULL,
branches_lwd = 0.6,
file,
width = NULL,
height = NULL,
long_data,
plot_method = c("ggplot", "plotly"),
label_names = NULL,
fontsize_row = 10,
fontsize_col = 10,
cexRow,
cexCol,
subplot_widths = NULL,
subplot_heights = NULL,
colorbar_len = 0.3,
colorbar_xanchor = if (row_dend_left) "right" else "left",
colorbar_yanchor = "bottom",
colorbar_xpos = if (row_dend_left) -0.1 else 1.1,
colorbar_ypos = 0,
showticklabels = c(TRUE, TRUE),
dynamicTicks = FALSE,
grid_size = 0.1,
node_type = "heatmap",
point_size_mat = NULL,
point_size_name = "Point size",
label_format_fun = function(...) format(..., digits = 4),
labRow = NULL,
labCol = NULL,
custom_hovertext = NULL,
col = NULL,
dend_hoverinfo = TRUE,
side_color_colorbar_len = 0.3
)
## S3 method for class 'heatmapr'
heatmaply(
x,
colors = viridis(n = 256, alpha = 1, begin = 0, end = 1, option = "viridis"),
limits = NULL,
na.value = "grey50",
row_text_angle = 0,
column_text_angle = 45,
subplot_margin = 0,
row_dend_left = FALSE,
margins = c(NA, NA, NA, NA),
...,
scale_fill_gradient_fun = scale_fill_gradientn(colors = if (is.function(colors))
colors(256) else colors, na.value = na.value, limits = limits),
grid_color = NA,
grid_gap = 0,
srtRow,
srtCol,
xlab = "",
ylab = "",
main = "",
titleX = TRUE,
titleY = TRUE,
hide_colorbar = FALSE,
key.title = NULL,
return_ppxpy = FALSE,
draw_cellnote = FALSE,
cellnote_color = "auto",
cellnote_textposition = "middle right",
cellnote_size = 12,
row_side_colors = x"row_side_colors",
row_side_palette = NULL,
col_side_colors = x"col_side_colors",
col_side_palette = NULL,
plot_method = c("ggplot", "plotly"),
ColSideColors,
RowSideColors,
heatmap_layers = NULL,
side_color_layers = NULL,
branches_lwd = 0.6,
label_names = c("row", "column", "value"),
fontsize_row = 10,
fontsize_col = 10,
subplot_widths = NULL,
subplot_heights = NULL,
colorbar_xanchor = if (row_dend_left) "right" else "left",
colorbar_yanchor = "bottom",
colorbar_xpos = if (row_dend_left) -0.1 else 1.1,
colorbar_ypos = 0,
colorbar_len = 0.3,
showticklabels = c(TRUE, TRUE),
dynamicTicks = FALSE,
node_type = c("scatter", "heatmap"),
grid_size = 0.1,
point_size_mat = x"matrix""point_size_mat",
point_size_name = "Point size",
label_format_fun = function(...) format(..., digits = 4),
custom_hovertext = x"matrix""custom_hovertext",
dend_hoverinfo = TRUE,
side_color_colorbar_len = 0.3
)
長くなるのでargumentsは省略。CRANのヘルプを参照して下さい。
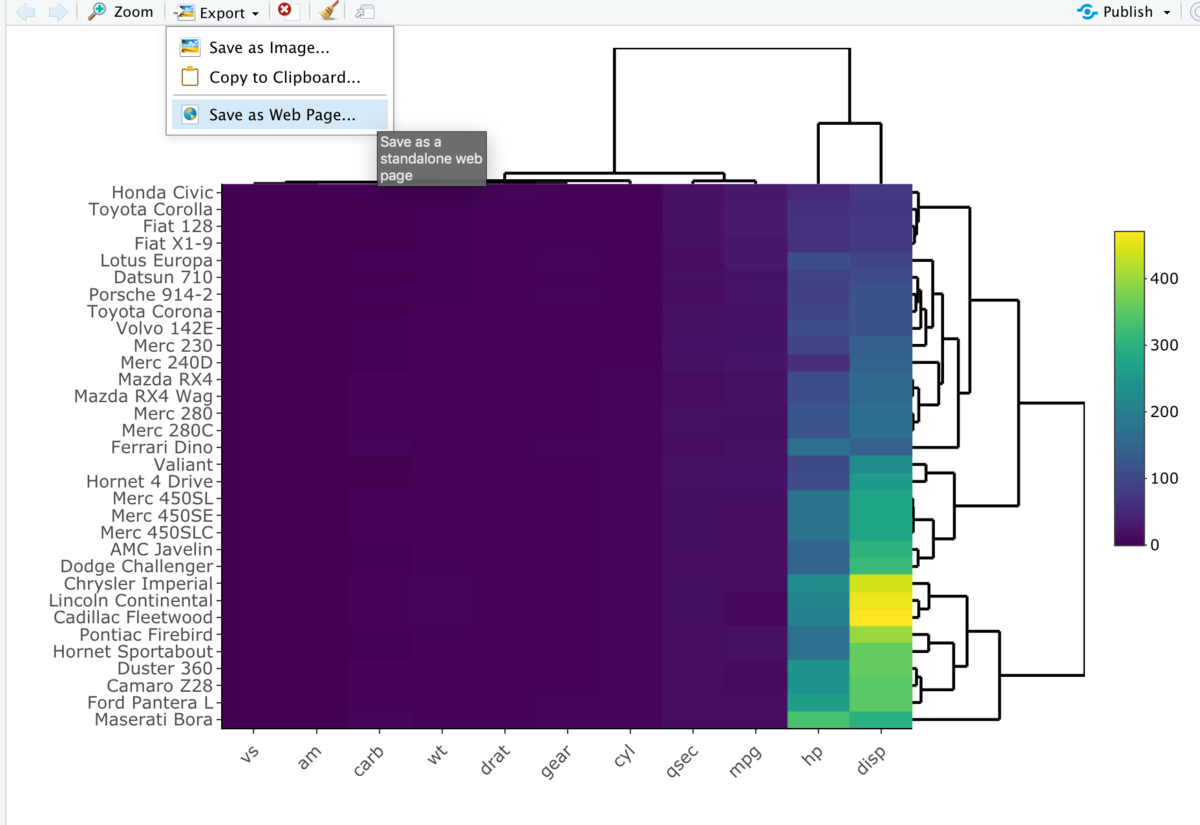
テストラン
library("heatmaply")
heatmaply(mtcars)
webページとして保存できる。

実行方法
1、heatmaplyのロード
library("heatmaply")
2、データの読み込み
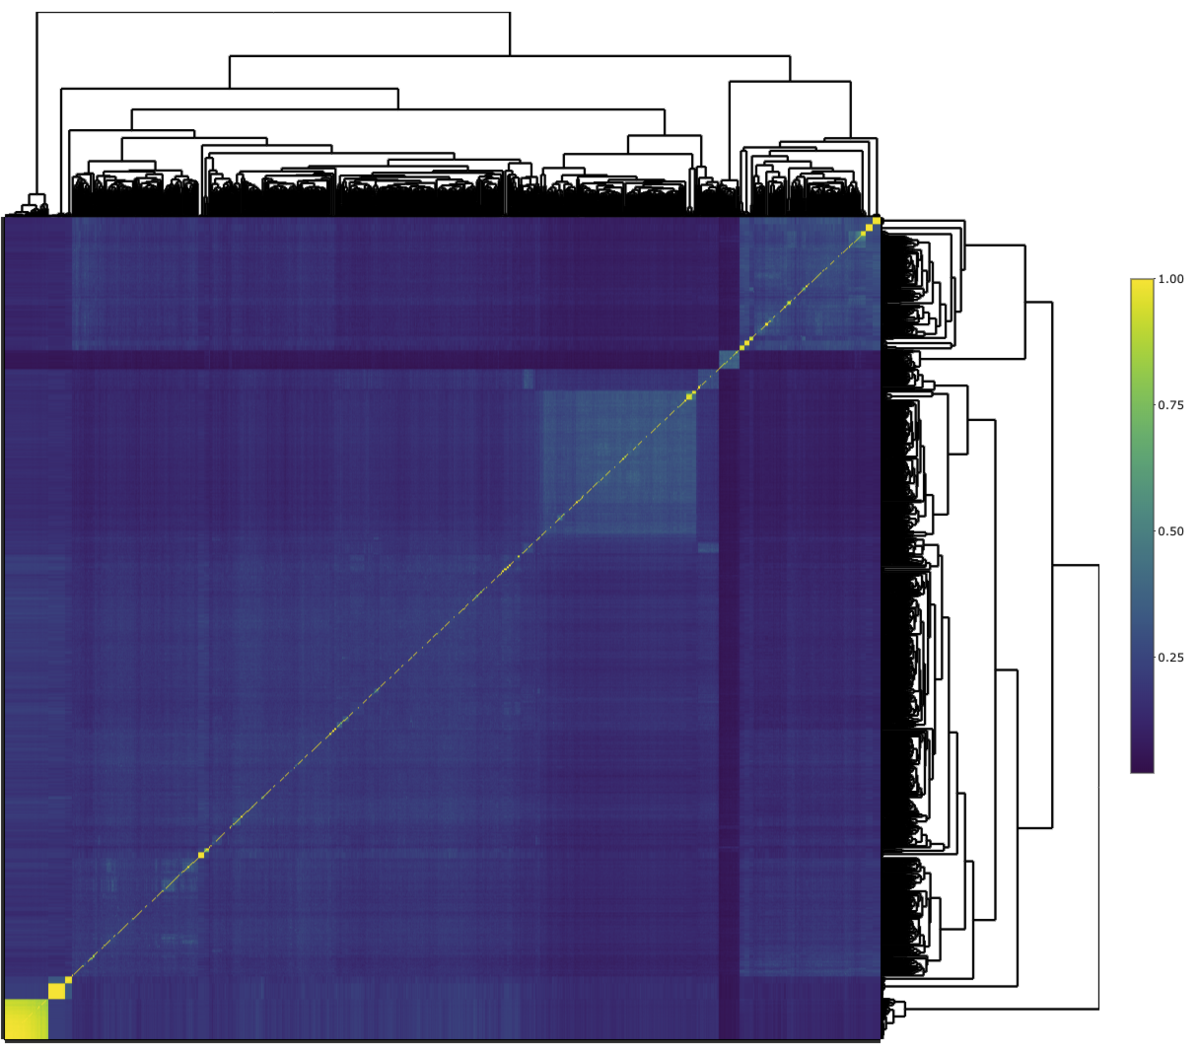
ここでは以下のANIの総当たり比較結果のデータを読み込む。
| Genome1 | Genome2 | Genome3 | |
| Genome1 | 100 | 95 | 98 |
| Genome2 | 95 | 100 | 92 |
| Genome3 | 98 | 92 | 100 |
コピペ読み込み。上の表を選択してコピーしておく。以下のコマンドを実行(コードをコピペするなら実行直前に上の表をコピーすること)。
#mac
x <- read.table(pipe("pbpaste"), header = TRUE)

#windows
x <- read.table("clipboard"), header = TRUE)
またはファイルinput.tsvに保存し、データフレームに読み込む。
x <- read.table("input.tsv", header=T, sep="\t")

#ファイルがカレントにないならフルパス指定. セパレータがコンマならsep=","
x <- read.table("/home/kazu/data/input.csv", header=T, sep=",")
3、ヒートマップで視覚化
heatmaply(x)

#font sizeのみ調整(default=10)
heatmaply(x, fontsize_row = 20, fontsize_col = 20)
Rstudioやjupyter notebookで実行していない場合、デフォルトブラウザに直接出力される。

heatmaply_corはheatmaplyのラッパーで、相関マトリックスに適したデフォルト設定、 具体的には、値が-1〜1に制限され、カラーパレットはRdBu(RColorBreweのカラー設定)になる。
heatmaply_cor(
 cor(mtcars),
 xlab = "Features",
 ylab = "Features",
 k_col = 2,
 k_row = 2
)
- k_col an integer scalar with the desired number of groups by which to color the den- drogram’s branches in the columns (uses color_branches) If NA then find_k is used to deduce the optimal number of clusters.
- k_row an integer scalar with the desired number of groups by which to color the den- drogram’s branches in the rows (uses color_branches) If NA then find_k is used to deduce the optimal number of clusters.
- xlab A character title for the x axis.
- ylab A character title for the y axis.
- main A character title for the heatmap.

他にも様々な例があります。上に載せたリンクから確認して下さい。
補足
shinyHeatmaply(ファーストオーサーの友人が開発と書かれています)も公開されています。簡単に使えるので興味があれば試してみて下さい。ただし、まだ開発中であり、環境によっては不安定な事もあるようです。
メモ
2000 x 2000 程度なら数分待てば動作する。

引用
heatmaply: an R package for creating interactive cluster heatmaps for online publishing
Tal Galili, Alan O’Callaghan, Jonathan Sidi, Carson Sievert
Bioinformatics, Volume 34, Issue 9, 01 May 2018, Pages 1600–1602
関連