macでインフォマティクス

macでインフォマティクス

HTS (NGS) 関連のインフォマティクス情報についてまとめています。

InParanoidをDIAMONDにより高速化した InParanoid-DIAMOND


 バイオインフォマティクスにおいて、祖先を共有する異なる生物種の遺伝子であるオルソログを予測することは重要な課題である。オルソログ予測ツールは、大量のデータを実行可能な時間内に解析するために、正確かつ高速に予測することが要求される。InParanoidはオルソログ解析のアルゴリズムとしてよく知られており、ベンチマークで良好な結果が得られているが、大規模なデータセットでは実行時間が長くなるという大きな制約がある。ここでは、InParanoidアルゴリズムのアップデート版として、相同性検索ステップにBLASTの代わりに高速なツールDIAMONDを使用できるようにしたものを紹介する。これにより、Quest for Orthologsベンチマークで同等の性能を得ながら、実行時間を94%削減することができた。ソースコードは(https://bitbucket.org/sonnhammergroup/inparanoid)で公開されている。


レポジトリより

InParanoid-DIAMONDは、異なるゲノムのタンパク質配列間の複雑なオーソログ関係を同定します。InParanoid-DIAMONDは、デフォルトの配列解析ツールであるBLASTに加え、DIAMONDを実装することにより、InParanoidの実行時間を最大93%短縮し、検出されたオルソログに対する信頼性はそのまま維持します。このパッケージは、DIAMONDスコアまたはBLASTスコアを用いてタンパク質の関連性を測定し、各グループに属する全てのパラログに対して信頼度を割り当てることができます。また、InParanoidはブートストラップ法を用いてオルソログの信頼度を計算することも可能です。


インストール

InParanoidは、プログラムの実行に必要なすべての依存関係を含むDockerコンテナとして提供している。公開されているdockerイメージを使用してテストした。inparanoidを実行するマシンでroot権限が得られない場合、Singularityを使ってDockerコンテナを実行することもできる(レポジトリ参照)。

#dockerhub(link)
docker pull sonnhammer/inparanoid

> docker run sonnhammer/inparanoid -help

###############################################################

InParanoid version 5.0

###############################################################


Accurate and fast ortholog detection with DIAMOND.

InParanoid-DIAMOND identifies complex orthologous relationships 

between protein sequences from different genomes. The package is 

capable of using either DIAMOND (default) or BLAST scores to 

measure relatedness of proteins, and assigns confidence values 

for all paralogs in each group.


RUN WITH DEFAULT SETTINGS AND TEST-FILES:

perl inparanoid.pl -input-dir ./testInput


OPTIONS:

-f1        Fasta file with protein sequences of species A

-f2        Fasta file with protein sequences of species B

-outgroup    Fasta file with protein sequences of species C 

        to use as outgroup [Default: no outgroup]

-input-dir    Directory containing fasta files for multiple

        species. Will run all vs all. If this option 

        is used, leave -f1 and -f2 empty. Note that 

        InParanoid will run species pairs sequentially,

        but Diamond will paralellize the sequence search

        using all available threads.

-out-dir    Specify a directory for the output files.

        [Default: ./output]


-seq-tool    Sequence similarity tool to use. 

        Options: Diamond, Blast [Default: Diamond]

-2pass        Run 2-pass approach. Not suitable for Diamond, 

        recommended for Blast [Default: False]

-bootstrap    Run bootstrapping to estimate confidence of 

        orthologs [Default: False]


-score-cutoff    Set bitscore cutoff. Any match below this 

        is ignored [Default: 40]

-seq-cutoff    Set sequence overlap cutoff. Match area should 

        cover at least this much of longer sequence. 

        Match area is the area from start of first 

        segment to end of last segment [Default: 0.5]

-seg-cutoff    Set segment coverage cutoff. Matching 

        segments must cover this much of the

        longer sequence [Default: 0.25]

-outgrp-cutoff    Set outgroup bitscore cutoff. Outgroup sequence

        hit must be this many bits stronger to reject 

        best-best hit between A and B [Default: 50]

-conf-cutoff    Set confidence cutoff. Include in-paralogs 

        with this confidence or better [Default: 0.05]

-grp-cutoff    Set group overlap cutoff. Merge groups if 

        ortholog in one group has more than this 

        confidence in other group [Default: 0.5]

-grey-zone    Set grey-zone. This many bits signifies the 

        difference between 2 scores [Default: 0]

-sensitivity    Set sensitivity mode for Diamond. 

        Options: mid-sensitive, sensitive, more-sensitive, 

        very-sensitive, ultra-sensitive. 

        [Default: very-sensitive]

-matrix        Specify a matrix to use when running Blast. 

        Options: BLOSUM62, BLOSUM45, BLOSUM80, PAM30, 

        PAM70 [Default: BLOSUM62]


-out-stats    Output statistics file [Default: False]

-out-table    Output tab-delimited table of orthologs to file 

        [Default: False]

-out-sqltable    Output sqltable file with orthologs [Default: True]

-out-html    Output html file with groups of orthologs 

        [Default: False]

-out-allPairs    Output allPairs file collecting all ortholog pairs

        from all SQLtable files present in the output

        directory. [Default: False]


-keep-seqfiles    Use this option to keep the resulting sequence tool

        files in the working directory. This will let you 

        run InParanoid without re-running the sequence 

        similarity tool. If false, these files will be moved

        to the output dir when done [Default: False]

-diamond-path    Explicitly state path to Diamond. Can be used if 

        Diamond is in a non-standard location, and not

        in user PATH [DEFAULT: diamond]

-blast-path    Explicitly state directory containing blastall and 

        formatdb. Can be used if Blast is in a non-

        standard location, and not in user PATH.

-cores        Use to specify the available cores. If DIAMOND is 

        used and this number is higher than twice the 

        -cores-diamond parameter, this number will be split 

        by -cores-diamond to run multiple instances of 

        InParanoid in paralell. If the number is lower, or

        if only one proteome-pair is run, all cores will 

        be used to run DIAMOND. If BLAST is used, this 

        number will specify the number of paralell 

        InParanoid instances. 

        [Default: using all available cores]

-cores-diamond    Use to specify the number of cores to use for each

        DIAMOND run. To optimize performance, please make 

        sure that this number is dividable by the total 

        number of cores used [Default: 4]


-debug        Activate debug mode [Default: False]

-notimes    Hide execution times [Default: False]

-help/-h    Show help


LICENSE:

 Distributed under the GNU General Public License (GPLv3). 

 See file COPYING


実行方法

InParanoidをコンテナで実行するには、-vコマンドで入力と出力のディレクトリをコンテナにマウントする。InParanoidプログラムは、ディレクトリ内のすべてのファイルを自動的に実行する。ここでは、複数の生物種のファスタファイルが格納されているディレクトリを入力に指定する。

cd  <path/to/your/input/files>/
mkdir outdir
docker run -v $PWD:/input -v $PWD/outdir:/output sonnhammer/inparanoid
  • -f1     Fasta file with protein sequences of species A

  • -f2     Fasta file with protein sequences of species B

  • -outgroup    Fasta file with protein sequences of species C to use as outgroup [Default: no outgroup]

  • -input-dir    Directory containing fasta files for multiple species. Will run all vs all. If this option is used, leave -f1 and -f2 empty. Note that InParanoid will run species pairs sequentially, but Diamond will paralellize the sequence search using all available threads.

  • -out-dir    Specify a directory for the output files. [Default: ./output]


InParanoidでは、fasta形式のプロテオームファイルを2つ以上入力する必要がある。入力ファイルのフォーマットについては、testInput/以下にあるサンプルファイル、ECとSCを参照してください。2つのプロテオームでプログラムを実行する場合、-f1, -f2オプションでファイル名を指定する。2つ以上のプロテオームでプログラムを実行する場合は、-input-dirオプションで、複数のプロテオームをFasta形式で格納したディレクトリへのパスを指定する。これにより、ディレクトリ内の全てのペアのファイルに対して InParanoid が実行される。


出力について

InParnoidは、デフォルトでは、SQLtableファイルのみが出力し、コマンドラインオプション -out-stats, -out-html, -out-table を使用することで、statsファイル、htmlファイル、tableファイルを出力する。SQLtableはタブ区切りのテキストファイルで、検索で生成されたオルソログのグループを含んでいる。


引用

InParanoid-DIAMOND: faster orthology analysis with the InParanoid algorithm 
Emma Persson, Erik L L Sonnhammer
Bioinformatics, Volume 38, Issue 10, 15 May 2022, Pages 2918–2919


関連


ユーザーフレンドリーなデータ可視化ウェブサーバー ImageGP


 データの可視化は,研究者の間で結果を説明し,知識を共有するために重要な役割を果たす.しかし、多くの可視化ツールは十分なコーディング経験を必要としたり、特殊な用途のために設計されていたり、無償でなかったりする。ここでは、生物・化学データの可視化に特化したプラットフォームであるImageGPを紹介する。ImageGPは、一般的な入力内容で、線、棒、散布図、箱、集合、ヒートマップ、ヒストグラムなどの汎用プロットを、使いやすいインタフェースで生成することができる。通常、ImageGPを使った作図は、マウスを数回クリックするだけで済む。一部のプロットでは、データを貼り付けて送信をクリックするだけで、可視化結果を得ることができる。さらに、ImageGP では、カスタマイズ可能な要件に対応するため、最大 26 のパラメータを提供する。ImageGPは、ボルケーノプロット、ほとんどのオミックスデータ解析のための機能エンリッチメントプロット、その他マイクロバイオーム解析のための4つの専門的なプロットも含んでいる。2017年以来、ImageGPは5年近く稼働し、世界中から336,951の訪問者にサービスを提供している。合わせて、ImageGP(http://www.ehbio.com/ImageGP/)は、実験研究者がウェットラボとドライラボから生成されたデータを包括的に可視化し、解釈するための効果的かつ効率的なツールである。


レポジトリ


Manual

http://www.ehbio.com/ImageGP/index.php/Home/Index/Manuals.html

More functions in the updated version of ImageGP

BIC - Bioinfo Intelligent Cloud


webサービス

http://www.ehbio.com/ImageGP/index.php/Home/Index/index.htmlにアクセスする。


Bar plotを見てみる。


Demoをクリックするとdemoデータが貼り付けられる。どのようなデータを用意すればよいのか理解しやすくなっている。


Wide formatかLong formatかも選べる。

Wide format

Long format


変数などのパラメータを指定する。遺伝子についての棒グラフを、IDごとにstackした状態で作る。


色を指定する場合、プロットする変数の種類だけ指定する必要がある。


他のパラメータも指定できる。Layputはグラフの形状に影響を与える。


PLOTをクリックすると視覚化される。結果はPDF形式でダウンロードできる。


Upset view


Density Plot

Histgram

Sankey diagram

PCoA plot

Venn diasgram

Manhattan plot


GO Enrichment Plot


LEFSe


他にもいくつかの可視化方法が利用できます。アクセスしてみて下さい。

引用

ImageGP: An easy-to-use data visualization web server for scientific researchers
Tong Chen,Yong-Xin Liu,Luqi Huang

iMeta, First published: 21 February 2022


アンプリコンベースの菌叢解析のための包括的なプラットフォーム MOCHI


 微生物叢の解析は、健康や科学にとって重要な意味を持つ。これらの解析では、16S/18S rRNA遺伝子シーケンスを利用して分類群を同定し、種の多様性を予測する。しかし、微生物叢データを解析するための利用可能なツールのほとんどは、適切な実装のために熟練したプログラミングスキルと深い統計的知識を必要とする。ロングリードアンプリコンシーケンスは、より正確な分類群の予測につながり、急速に普及しつつあるが、実務者が簡単に利用できる解析ツールはない。ここでは、微生物相アンプリコンシーケンス解析のためのGUIツールであるMOCHIを発表する。MOCHIは、配列の前処理、分類の割り当て、異なる豊富な種の同定、種の多様性と機能の予測を行う。16S/18S rRNAの部分配列や16S rRNA全長配列の分類数表やFASTQを入力とし、リアルタイムで解析を行う。リアルタイムで解析を行い、表形式とグラフ形式の両方でデータを可視化する。MOCHIはローカルにインストールすることも、ウェブツールとして https://mochi.life.nctu.edu.tw からアクセスすることもできる。


ショートリードのアンプリコンだけでなく、ロングリードのアンプリコンにも対応しています。


webサービス

https://mochi.life.nctu.edu.tw/にアクセスする。


1、Sequence Preprocessingタブ

Sequence PreprocessingのStep1を選択する。

fastq.gzかfq.gzのシークエンシングデータをアップロードする。ここではExample sequences ボタンからサンプルファイルをダウンロードし、そのファイルをアップロードした。


パラメータを設定する。シングルエンドまたはペアエンド、もしくはロングリードかどうか、プライマーの種類、計算スレッド数を指定する。0の場合、利用可能なすべてのコアが使用される。

STARTをクリックする。ジョブIDは解析結果を取得するために使用され、2週間サーバーに保存される。


Sequencing counts summary

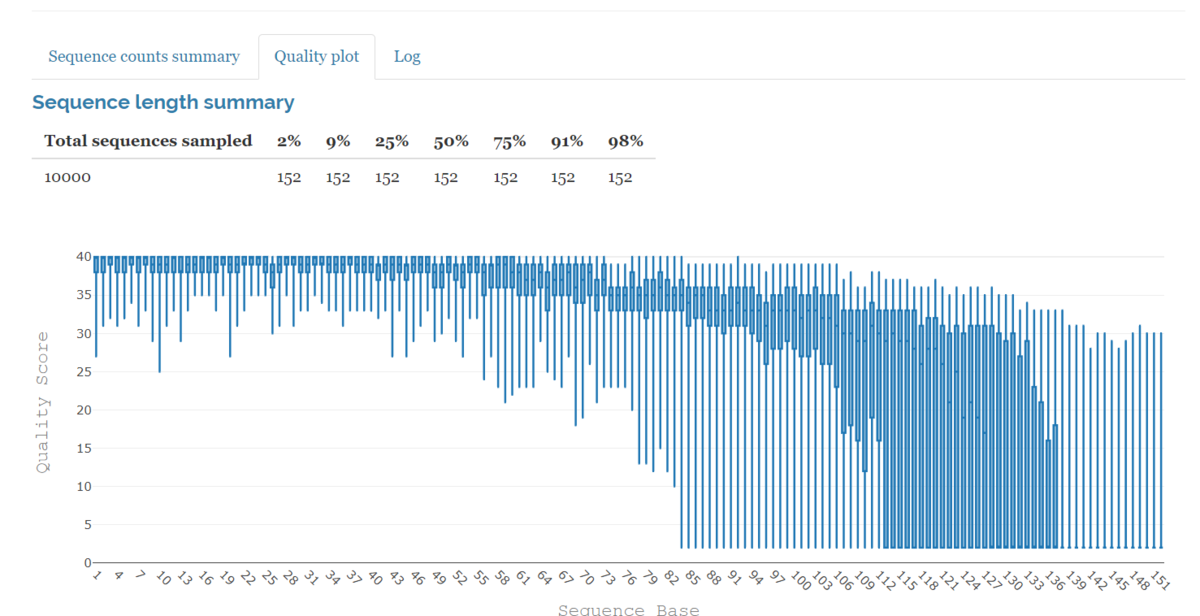
Quality plot


Step 2. Sequence denoisingを選択する。Step 1.で選択したシーケンスの種類によって、設定内容が異なる。

  • トリミングの開始位置、終了位置、Quality Scoreを設定する。開始位置より下、終了位置より上の塩基対は切り落とされる。例えば、開始位置を5、終了位置を120に設定すると、5〜120bpの配列が得られる。また、終了位置より短いリードは破棄される。End positionが0の場合、切り捨てや長さのフィルタリングは行われない。
  • Quality scoreについては、品質スコアが指定値以下のヌクレオチドが切り捨てられる。
  • キメラリードとは、複数の親配列に由来する配列を意味する。キメラリードは一般にコンタミだが新規配列と解釈される可能性がある。が、実際はアーチファクトである。Chimeric reads filteringの値が高いほど、より多くのキメラリードが解析に使用される。ほとんどの場合、1がデフォルト値。

(マニュアルより)

パラメータを決めたらSTARTをクリックする。


出力例


Filter info

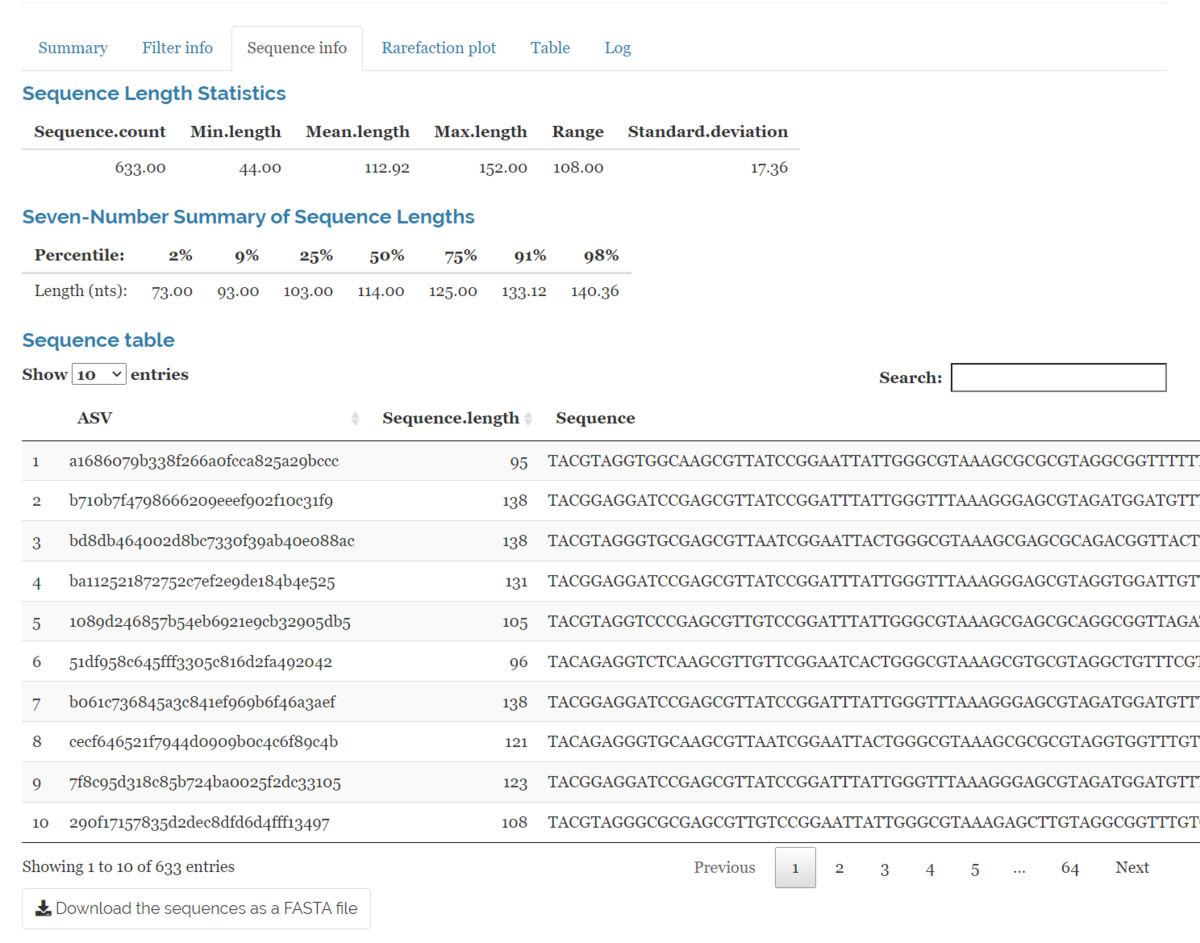
Sequence info


Rarefraction plot

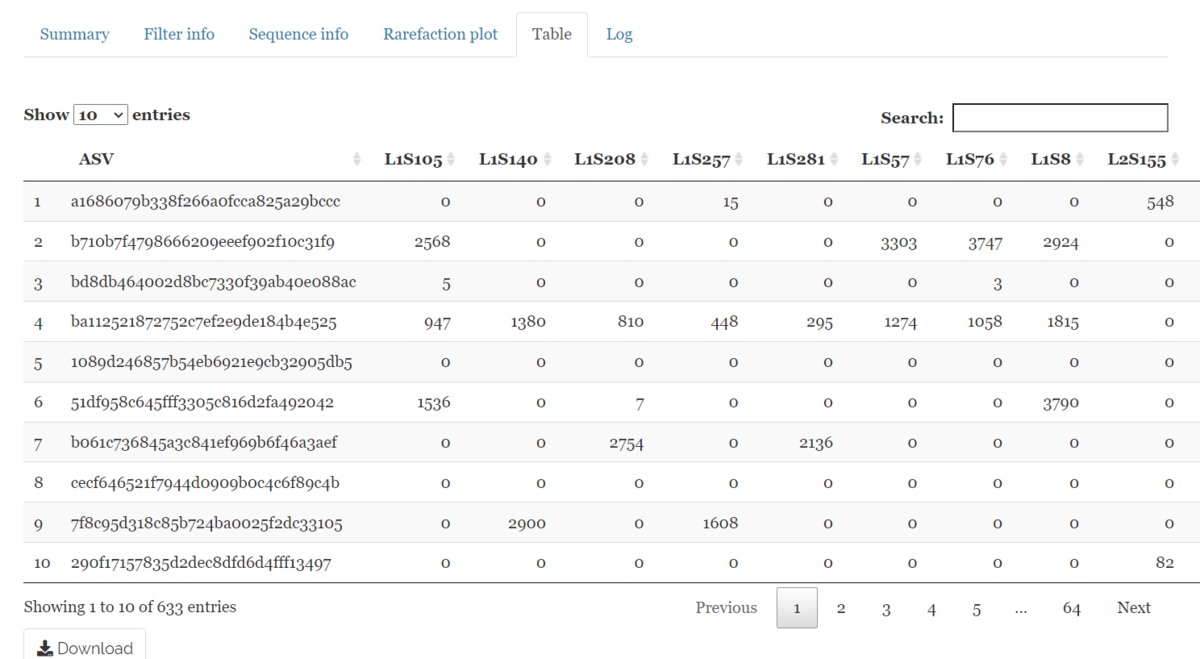
ASV

すべてのサンプルにおける各ASVのリードカウント。


Step 3. Taxonomy classificationを選択する。Step 1.で選択したシーケンスの種類によって、設定内容が異なる。


分類群を予測するためのデータベース(Silva、Greengene、PR2)を選択する。最新のデータベースがサーバーからダウンロードされ取り込まれる。


指定された値の範囲外のリファレンス配列は破棄される。デフォルト値は、ノイズ除去された配列の最小および最大の長さになる。長さフィルタリングを無効にするには値をゼロに設定する。

最小のデフォルト値はdenoised-sequencesの中央値 - 100、最大の デフォルト値はdenoised-sequencesの中央値 + 100。


出力例

ASVと割り当てられた分類群が表示される。

分類テーブル、ASVテーブルをダウンロードできる。


2、Taxonomic analysisタブ

メタデータ、分類テーブル、ASVテーブル(OTUテーブル)のファイルをアップロードする。分類テーブル、ASVテーブルはSequence Preprocessingタブで得られる(MOCHI/QIIME2形式指定)。18Sなら18Sにチェックを付ける。


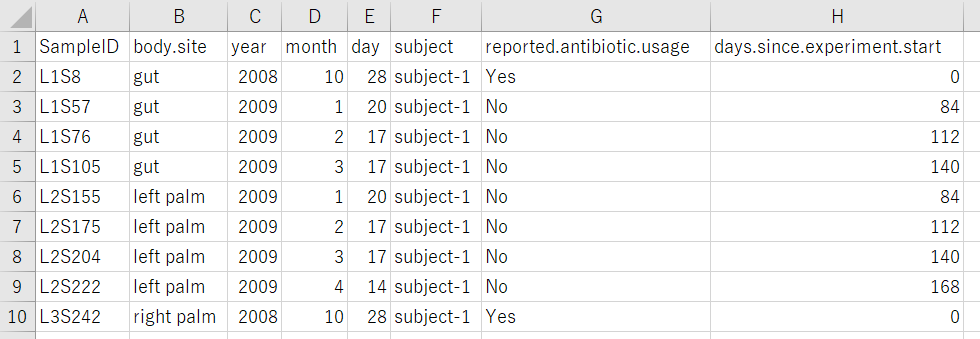
メタデータ。最初のカラム名は必ずSampleIDにする。


パラメータを決めたらSTARTをクリックする。


出力例

Taxonomic table

K はあるレベルの分類群の数を示す。表の右側にはリードカウントが表示される。これらは選択されたグループによって分類されている。


Taxonomic barplot

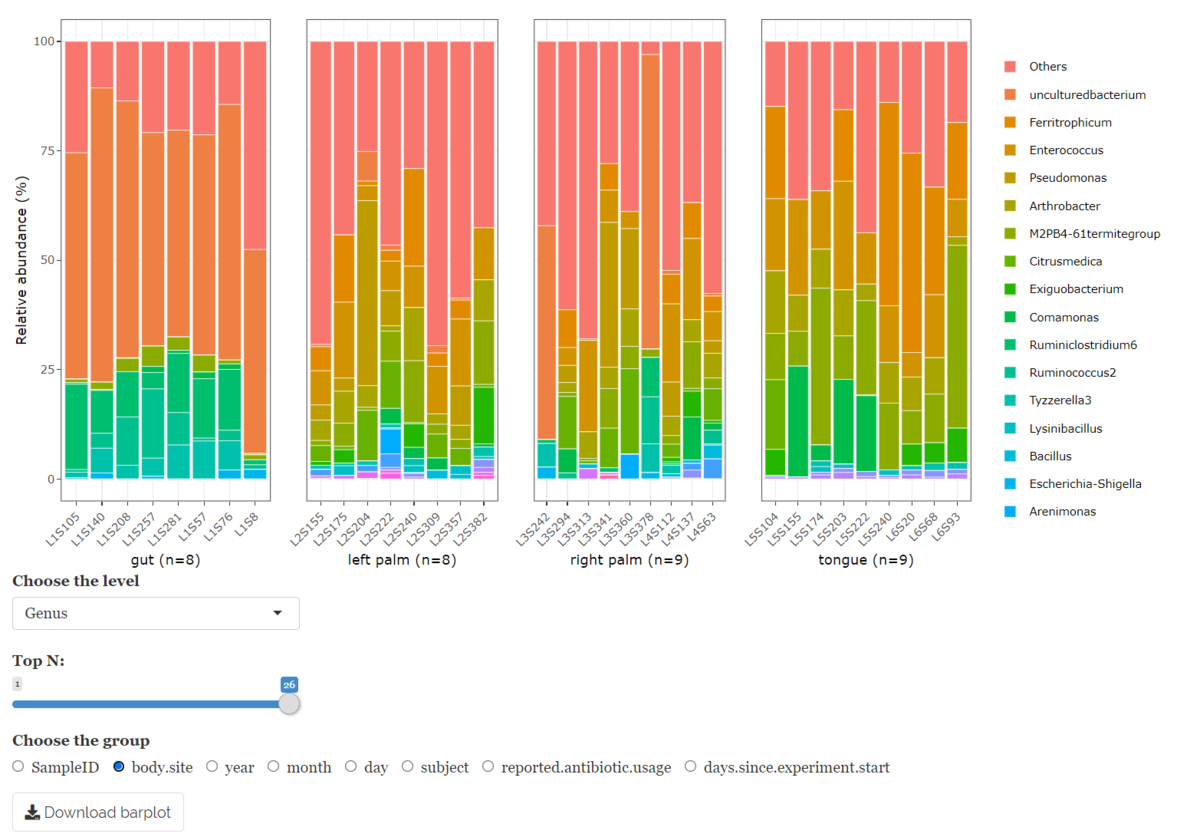
全サンプルの分類群のパーセンテージを示すインタラクティブなバープロット。


下のメニューのメタデータによって結果をグループ化できる。このメタデータはユーザーが提供したテキストに依存している。body.siteを選択。

N の値を指定すると、プロットは各サンプルで比較的多い上位 N 種の分類群の和が表示される。例えばN = 2 の場合、サンプル A とサンプル B の上位 2 種類の豊富な分類群が「taxa_1 and taxa_2」、「taxa_1 と taxa_3」であった場合、プロットではtaxa_1、taxa_2、taxa_3 の相対的な存在量が示される。(マニュアルより)


Taxonomic heatmap

log10変換されたパーセンテージを示すインタラクティブなヒートマップ。ゼロの対数を取らないようにするため、変換前にすべてのパーセント値に小さな値0.01が足されている。


genusレベル、subjectでグループ化。


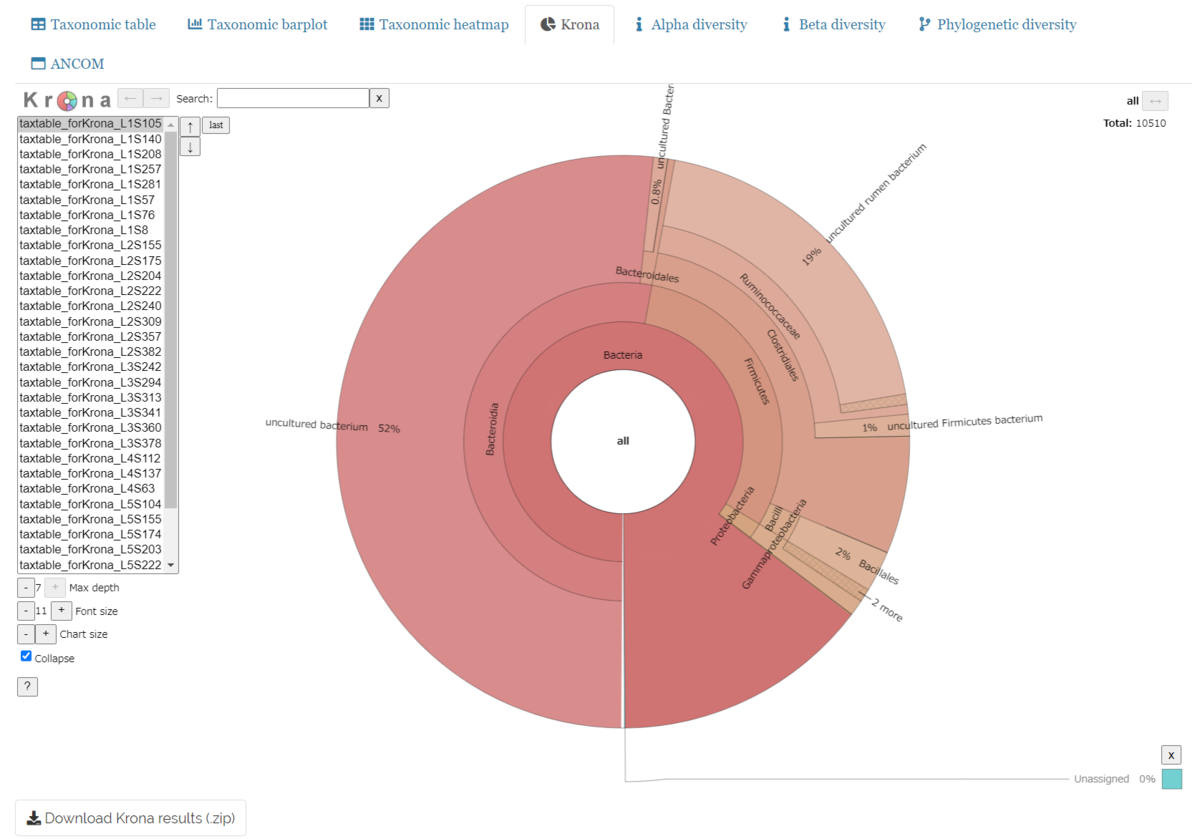
Krona


Alpha diversity

6つのアルファ多様性インデックスの値;ACE, Shannon diversity, InvSimpson diversity, Shannon evenness, and Simpson evennessで示される。


Shannon diversityを選択、Yearでグループ化。ANOVA(パラメトリック手法)または Kruskal-Wallis(ノンパラメトリック手法)を選択し、指数の分布が有意であるかどうかを検定する。


Beta diversity

サンプル間の種の多様性を評価するための指標。MOCHIではBray-Curtis指数を用いている。


ヒートマップ上にカーソルを置くと、種間の距離が表示される。

ヒートマップに表示される数値は、元の数値の自然対数を0.01倍したもの。


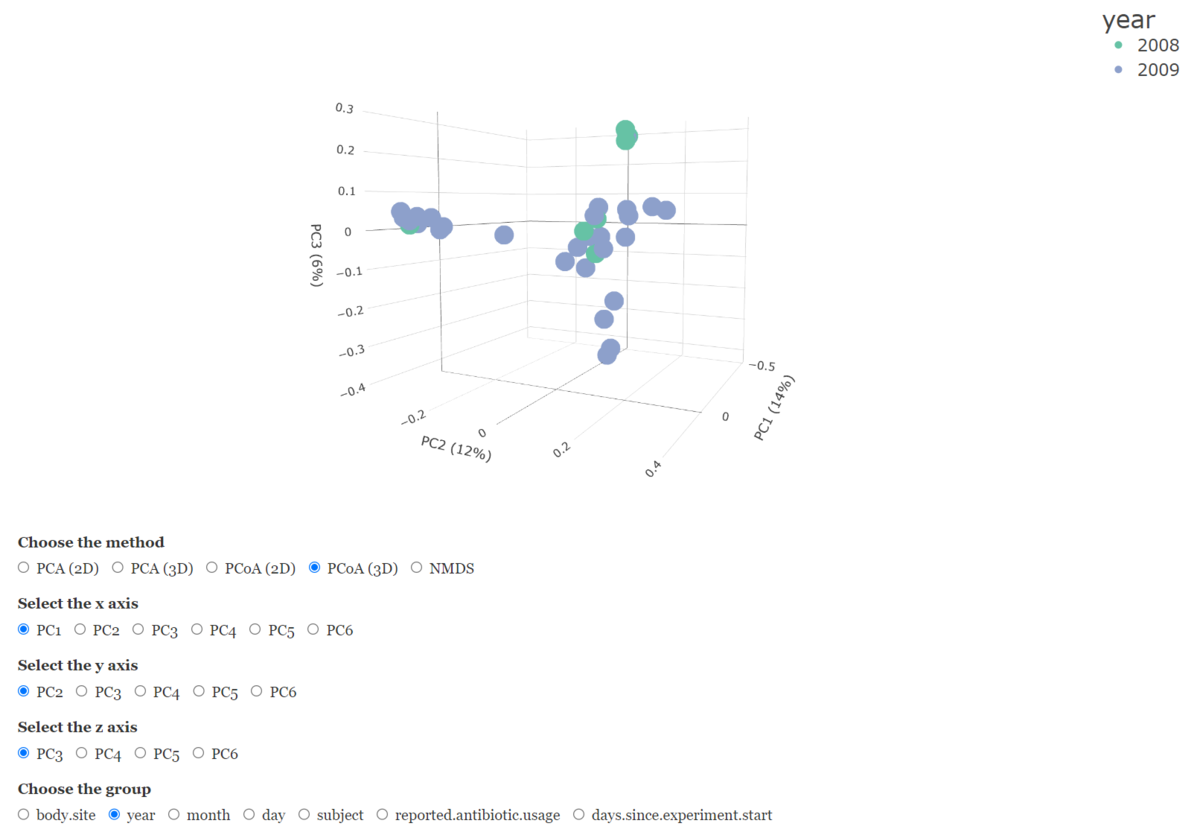
ベータ版の多様性を可視化するために、PCA (Principal Component Analysis, 2D & 3D), PCoA (Principal Co-ordinates Analysis,2D & 3D) 、NMDS (Non-metric Multidimensional Scaling)の3種類の次元削減法が提供されている。


PCoA 3D、year、PC1, PC2, PC3。


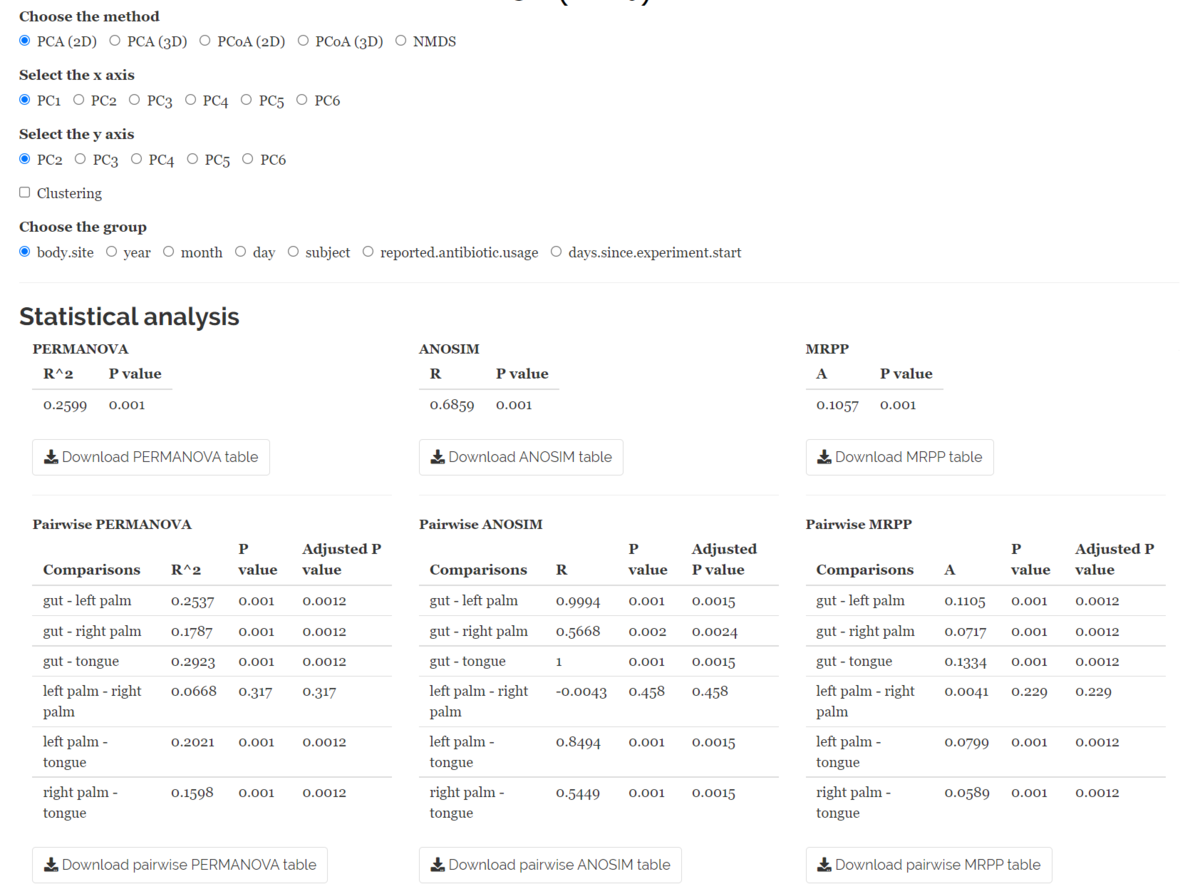
Statistical analysis

β多様性がグループ間、あるいはペア間で有意に異なるかどうか調べるために、PerMANOVA(順列多変量解析)、ANOSIM(類似性解析)、MRPP(多重応答並べ替え法)の3つの統計手法を提供している。


Phylogenic diversity

種間の遺伝的な差異を定量的に把握するための多様性の指標。シーケンスファイル(.qza)をアップロードする。配列の前処理を完了している場合は、「配列の前処理-分類」の後にファイルをダウンロードする。

詳細はマニュアル参照。


3、Function analysis

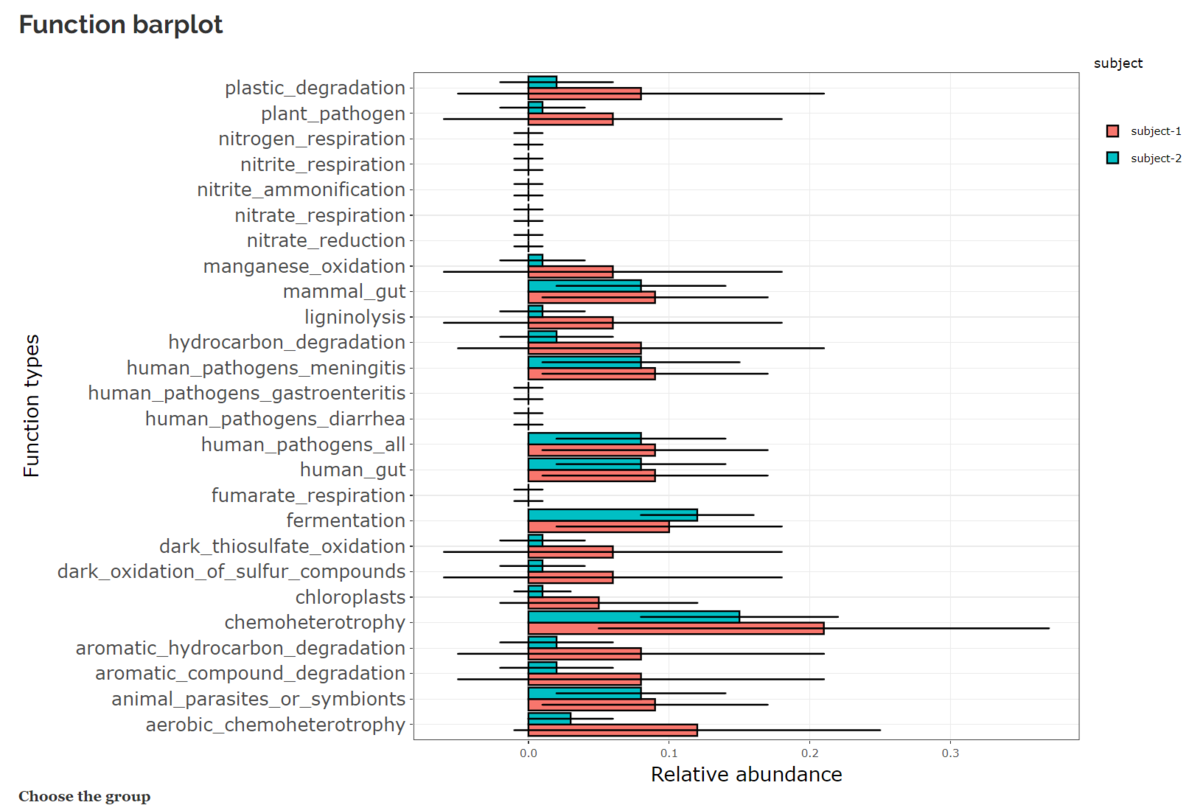
微生物相の機能を予測するためのデータベースFAPROTAXを利用した機能解析。

メタデータ、分類テーブルのファイルをアップロードする。分類テーブルはSequence Preprocessingタブで得られる(MOCHI/QIIME2形式指定)。


出力例

機能アノテーションテーブル。各サンプルの機能タイプを表示する。

Function plot

各機能のリード数がメタデータに基づいてグループ化されている。


subjectに変更。


引用
MOCHI, a comprehensive cross-platform tool for amplicon-based microbiota analysis
Jun-Jie Zheng, Po-Wen Wang, Tzu-Wen Huang, Yao-Jong Yang, Hua-Sheng Chiu, Pavel Sumazin, Ting-Wen Chen

Bioinformatics. 2022 Jul 25;btac494


分類学的情報の注釈付き系統樹を生成する TaxOnTree


 系統解析は、遺伝子/タンパク質/種の進化を解析し、説明するために広く用いられている手法であり、DNA/ゲノムの配列が決定されている種の増加に伴い、その恩恵を受けている。数百の生物種の塩基配列から系統樹を作成することは、日常的な作業と考えることができる。しかし、系統樹の可視化には、サンプリングされた遺伝子やタンパク質に関する関連情報(例えば、分類学)を整理し、アクセス可能な手段でもたらすことが課題となっている。ここでは、系統樹にサンプルの分類学的情報を取り込み、迅速にアクセスできる計算ツールTaxOnTreeを紹介する。TaxOnTreeは、NCBIまたはUniprotデータベースの遺伝子/タンパク質識別子を含むNewick形式の系統樹を入力とするが、タンパク質識別子、FASTAのタンパク質1個、タンパク質アクセッションのリスト、またはアラインされていないマルチFASTAファイルを入力とすることも可能である。ツリー以外の入力は、TaxOnTreeに実装された系統樹再構築パイプラインに送信される。ユーザーから提供されたツリーやパイプラインで生成されたツリーは、Nexus形式に変換され、ツリーを構成する各サンプルの分類学的情報が自動的にアノテーションされる。分類学的情報は、NCBIやUniprotのサーバ、またはローカルのMySQLデータベースからWebリクエストで取得され、ツリーノードにタグとしてアノテーションされる。最終的なツリーアーカイブNexus形式であり、FigTreeソフトウェアで開く必要がある。TaxOnTree は、オルソログおよびパラログの分類学的分布を迅速に確認することができる。分類学/系統学的なシナリオを手動でキュレーションしたり、相同配列をシード配列にリンクさせるツールと組み合わせて使用することができる。TaxOnTreeは、分類学の専門家でなくても、分類学的な視点で系統樹を観察できるよう、計算機的なサポートを提供する。TaxOnTree は、http://bioinfo.icb.ufmg.br/taxontree で利用できる。


SourceForge


webサービス

http://bioinfo.icb.ufmg.br/taxontree/にアクセスする。


系統解析したいタンパク質の識別子かタンパク質配列を入力する。


複数も可能。


タンパク質配列を指定する場合はBLASTのデータベースも指定する。デフォルトはUniProtになっている。


最後にsubmitをクリック。


クエリの種と他の種との間のLCA (Lowest Common Ancestor)が確認される。分類学上のランク(Family, Order, Class, etc)に従ってタンパク質が分類される。得られた分類情報に従って、系統樹に色が付けられる。


job IDが表示されるので記録しておく。


jobIDを指定して結果をダウンロードする。ツリーフォーマットは下の画像の形式から選べる。SVG形式でもダウンロードできる。


Linux版のFigtreeにNexus形式のツリーファイルを読み込んだ。


引用

TaxOnTree: a tool that generates trees annotated with taxonomic information
Tetsu Sakamoto,  J. Miguel Ortega

bioRxiv, Posted December 24, 2020


関連


gtdbtkのde_novo_wfコマンド


マニュアルより

gtdbtkのde novo ワークフローは、ユーザー提供のゲノムと GTDB-Tk リファレンスゲノムを含むバクテリア古細菌のツリーを推論する。分類学的な分類を得るにはclassify_wfワークフローを推奨し、de novoでdomain固有のツリーが必要な場合のみ本ワークフローを推奨する。このワークフローは、identify, align, infer, root, decorate の 5 つのステップで構成されている。identifyとalignのステップは、分類ワークフローと同じになっている。inferステップでは、FastTreeとWAG+GAMMAモデルを使用して、独立したde novoの細菌と古細菌のツリーを計算する。これらのツリーは、ユーザーが指定したアウトグループを使ってルート化され、GTDB taxonomyで装飾される。


de_novo_wf

https://ecogenomics.github.io/GTDBTk/commands/de_novo_wf.html


インストール

Github

#bioconda(link
mamba create -n gtdbtk -c conda-forge -c bioconda gtdbtk -y
conda activate gtdbtk

> gtdbtk

              ...::: GTDB-Tk v2.1.0 :::...


  Workflows:

    classify_wf -> Classify genomes by placement in GTDB reference tree

                     (identify -> align -> classify)

    de_novo_wf  -> Infer de novo tree and decorate with GTDB taxonomy

                     (identify -> align -> infer -> root -> decorate)


  Methods:

    identify -> Identify marker genes in genome

    align    -> Create multiple sequence alignment

    classify -> Determine taxonomic classification of genomes

    infer    -> Infer tree from multiple sequence alignment

    root     -> Root tree using an outgroup

    decorate -> Decorate tree with GTDB taxonomy


  Tools:

    infer_ranks     -> Establish taxonomic ranks of internal nodes using RED

    ani_rep         -> Calculates ANI to GTDB representative genomes

    trim_msa        -> Trim an untrimmed MSA file based on a mask

    export_msa      -> Export the untrimmed archaeal or bacterial MSA file

    remove_labels   -> Remove labels (bootstrap values, node labels) from an Newick tree

    convert_to_itol -> Convert a GTDB-Tk Newick tree to an iTOL tree


  Testing:

    test          -> Validate the classify_wf pipeline with 3 archaeal genomes 

    check_install -> Verify third party programs and GTDB reference package


  Use: gtdbtk <command> -h for command specific help


> gtdbtk de_novo_wf  

usage: gtdbtk de_novo_wf (--genome_dir GENOME_DIR | --batchfile BATCHFILE) (--bacteria | --archaea) --outgroup_taxon OUTGROUP_TAXON --out_dir OUT_DIR [-x EXTENSION] [--skip_gtdb_refs] [--taxa_filter TAXA_FILTER] [--min_perc_aa MIN_PERC_AA] [--custom_msa_filters]

                         [--cols_per_gene COLS_PER_GENE] [--min_consensus MIN_CONSENSUS] [--max_consensus MAX_CONSENSUS] [--min_perc_taxa MIN_PERC_TAXA] [--rnd_seed RND_SEED] [--prot_model {JTT,WAG,LG}] [--no_support] [--gamma]

                         [--gtdbtk_classification_file GTDBTK_CLASSIFICATION_FILE] [--custom_taxonomy_file CUSTOM_TAXONOMY_FILE] [--write_single_copy_genes] [--prefix PREFIX] [--genes] [--cpus CPUS] [--force] [--tmpdir TMPDIR] [--keep_intermediates] [--debug] [-h]


mutually exclusive required arguments:

  --genome_dir GENOME_DIR

                        directory containing genome files in FASTA format

  --batchfile BATCHFILE

                        path to file describing genomes - tab separated in 2 or 3 columns (FASTA file, genome ID, translation table [optional])


mutually exclusive required arguments:

  --bacteria            process bacterial genomes (default: False)

  --archaea             process archaeal genomes (default: False)


required named arguments:

  --outgroup_taxon OUTGROUP_TAXON

                        taxon to use as outgroup (e.g., p__Patescibacteria or p__Altarchaeota)

  --out_dir OUT_DIR     directory to output files


optional arguments:

  -x, --extension EXTENSION

                        extension of files to process, gz = gzipped (default: fna)

  --skip_gtdb_refs      do not include GTDB reference genomes in multiple sequence alignment (default: False)

  --taxa_filter TAXA_FILTER

                        filter GTDB genomes to taxa (comma separated) within specific taxonomic groups (e.g.: d__Bacteria or p__Proteobacteria,p__Actinobacteria)

  --min_perc_aa MIN_PERC_AA

                        exclude genomes that do not have at least this percentage of AA in the MSA (inclusive bound) (default: 10)

  --custom_msa_filters  perform custom filtering of MSA with cols_per_gene, min_consensus max_consensus, and min_perc_taxa parameters instead of using canonical mask (default: False)

  --cols_per_gene COLS_PER_GENE

                        maximum number of columns to retain per gene when generating the MSA (default: 42)

  --min_consensus MIN_CONSENSUS

                        minimum percentage of the same amino acid required to retain column (inclusive bound) (default: 25)

  --max_consensus MAX_CONSENSUS

                        maximum percentage of the same amino acid required to retain column (exclusive bound) (default: 95)

  --min_perc_taxa MIN_PERC_TAXA

                        minimum percentage of taxa required to retain column (inclusive bound) (default: 50)

  --rnd_seed RND_SEED   random seed to use for selecting columns, e.g. 42

  --prot_model {JTT,WAG,LG}

                        protein substitution model for tree inference (default: WAG)

  --no_support          do not compute local support values using the Shimodaira-Hasegawa test (default: False)

  --gamma               rescale branch lengths to optimize the Gamma20 likelihood (default: False)

  --gtdbtk_classification_file GTDBTK_CLASSIFICATION_FILE

                        file with GTDB-Tk classifications produced by the `classify` command

  --custom_taxonomy_file CUSTOM_TAXONOMY_FILE

                        file indicating custom taxonomy strings for user genomes, that should contain any genomes belonging to the outgroup. Format: GENOME_ID<TAB>d__;p__;c__;o__;f__;g__;s__

  --write_single_copy_genes

                        output unaligned single-copy marker genes (default: False)

  --prefix PREFIX       prefix for all output files (default: gtdbtk)

  --genes               indicates input files contain called genes (skip gene calling) (default: False)

  --cpus CPUS           number of CPUs to use (default: 1)

  --force               continue processing if an error occurs on a single genome (default: False)

  --tmpdir TMPDIR       specify alternative directory for temporary files (default: /tmp)

  --keep_intermediates  keep intermediate files in the final directory (default: False)

  --debug               create intermediate files for debugging purposes (default: False)

  -h, --help            show help message


> gtdbtk convert_to_itol -h

usage: gtdbtk convert_to_itol --input_tree INPUT_TREE --output_tree OUTPUT_TREE [--debug] [-h]


required named arguments:

  --input_tree INPUT_TREE

                        path to the unrooted tree in Newick format

  --output_tree OUTPUT_TREE

                        path to output the tree


optional arguments:

  --debug               create intermediate files for debugging purposes (default: False)

  -h, --help            show help message


実行方法

1、fasta形式のゲノムディレクトリとfastaファイルの拡張子、ドメイン、アウトグループの分類(ルートになる)、出力ディレクトリを指定する。オプションで--skip_gtdb_refsを付けるとGTDB reference genomeが含まれない。ただし。その場合は--custom_taxonomy_fileオプションも付けてGENOME_ID<TAB>d__;p__;c__;o__;f__;g__;s__形式のtaxonomy情報を提供する必要がある( de_novo_wfでは要求されるがclassify_wfでは要求されない)。もしくは、--taxa_filterオプションでtaxonomy情報を提供すると、指定した分類群に属するゲノムだけ系統推論結果(系統樹)に保存される。その場合、その分類群に属するGTDB reference genomeも含まれる。prot_modelでツリー推定に用いるタンパク質置換モデル (LGまたはWAG; default: WAG)を指定できる。

gtdbtk de_novo_wf --genome_dir genomes/ --bacteria -x fna --outgroup_taxon p__Chloroflexota --taxa_filter p__Firmicutes --out_dir de_novo_output --cpus 20
  • --genome_dir   directory containing genome files in FASTA format
  • --bacteria    process bacterial genomes (default: False)
  • --archaea    process archaeal genomes (default: False)
  •  --outgroup_taxon   taxon to use as outgroup (e.g., p__Patescibacteria or p__Altarchaeota)

  • --out_dir    directory to output files

  • -x    extension of files to process, gz = gzipped (default: fna)

  • --skip_gtdb_refs    do not include GTDB reference genomes in multiple sequence alignment (default: False)

  • --taxa_filter    filter GTDB genomes to taxa (comma separated) within specific taxonomic groups (e.g.: d__Bacteria or p__Proteobacteria,p__Actinobacteria) 

  • --custom_taxonomy_file   file indicating custom taxonomy strings for user genomes

  • --prot_model {JTT, WAG, LG}    protein substitution model for tree inference (default: WAG


出力例

gtdbtk.bac120.decorated.treeがツリーファイル(bacteriaの時)。


2、Qiime1の filter_tree.pyスクリプトで、gtdbtk.bac120.decorated.treeからGTDB referenceのleafだけフィルタリングすることができる。

https://kazumaxneo.hatenablog.com/entry/2022/08/08/140937


3、フィルタリング後、iTOLでツリーを可視化するには、 gtdbtk convert_to_itolコマンドを実行する。

gtdbtk convert_to_itol --input_tree input.tree --output_tree output.tree
  • --input_tree      path to the unrooted tree in Newick format
  • --output_tree   path to output the tree

output.treeをiTOLに読み込む。


引用

GTDB-Tk v2: memory friendly classification with the Genome Taxonomy Database
 Pierre-Alain Chaumeil,  Aaron J Mussig,  Philip Hugenholtz,  Donovan H Parks

bioRxiv, Posted July 22, 2022.


関連


系統樹ファイルをチップ名(leaf)でフィルタリングする filter_tree.py スクリプト

8/8 誤字修正


QIIME1のfilter_tree.pyスクリプト(QIIME2ではqiime phylogeny filter-tree)は、系統樹ファイルから入力されたリスト(OTU名、ゲノム名など)で見つかったツリーのチップだけを保持するサブツリーを出力する。-negateオプションのTRUEフラグを立てると、見つからなかったサブツリーを返す。


QIIME1

filter_tree.py – This script prunes a tree based on a set of tip names — Homepage

QIIME2

https://docs.qiime2.org/2022.2/plugins/available/phylogeny/filter-tree/?highlight=filter_tree%20py


インストール

依存関係が多いので、公開されているQIIME1のdocker image(非公式)を使用した。

QIIME2

QIIME1

#dockerhub, github
docker pull mbari/qiime1:latest

filter_tree.py -h

# filter_tree.py -h

Usage: filter_tree.py [options] {-i/--input_tree_filepath

INPUT_TREE_FP -o/--output_tree_filepath OUTPUT_TREE_FP}


[] indicates optional input (order unimportant)

{} indicates required input (order unimportant)


This script takes a tree and a list of OTU IDs (in one of several

supported formats) and outputs a subtree retaining only the tips on

the tree which are found in the inputted list of OTUs (or not found,

if the --negate option is provided).


Example usage:

Print help message and exit

 filter_tree.py -h


Prune a tree to include only the tips in tips_to_keep.txt:

 filter_tree.py -i rep_seqs.tre -t tips_to_keep.txt -o pruned.tre


Prune a tree to remove the tips in tips_to_remove.txt. Note that the

-n/--negate option must be passed for this functionality:

 filter_tree.py -i rep_seqs.tre -t tips_to_keep.txt -o negated.tre -n


Prune a tree to include only the tips found in the fasta file provided:

 filter_tree.py -i rep_seqs.tre -f fast_f.fna -o pruned_fast.tre


Options:

  --version             show program's version number and exit

  -h, --help            show this help message and exit

  -v, --verbose         Print information during execution -- useful for

                        debugging [default: False]

  -n, --negate          if negate is True will remove input tips/seqs, if

                        negate is False, will retain input tips/seqs [default:

                        False]

  -t TIPS_FP, --tips_fp=TIPS_FP

                        A list of tips (one tip per line) or sequence

                        identifiers   (tab-delimited lines with a seq

                        identifier in the first field)   which should be

                        retained   [default: none]

  -f FASTA_FP, --fasta_fp=FASTA_FP

                        A fasta file where the seq ids should be retained

                        [default: none]


  REQUIRED options:

    The following options must be provided under all circumstances.


    -i INPUT_TREE_FP, --input_tree_filepath=INPUT_TREE_FP

                        input tree filepath [REQUIRED]

    -o OUTPUT_TREE_FP, --output_tree_filepath=OUTPUT_TREE_FP

                        output tree filepath [REQUIRED]


実行方法

1、ここではdockerイメージを立ち上げて環境内で作業する。

cd <path>/<to>/<tree_dir>/
docker run -itv $PWD:/data -w /data --rm mbari/qiime1:latest
source activate qiime1


2、保持するOTU名やゲノム名を記入したリスト(1行に1つずつ)と、フィルタリングするツリーファイル名、出力ツリーファイル名を指定する。”-n”をつけるとリストに含まれないツリーが出力される。

filter_tree.py -i input.tre -t tips_keep.txt -o output.tre
  • -t    A list of tips (one tip per line) or sequence identifiers   (tab-delimited lines with a seq identifier in the first field)   which should be retained   [default: none]
  •  -i     input tree filepath [REQUIRED]
  • -o    output tree filepath [REQUIRED] 
  •  -n  if negate is True will remove input tips/seqs, if negate is False, will retain input tips/seqs 


引用

Reproducible, interactive, scalable and extensible microbiome data science using QIIME 2

Evan Bolyen, Jai Ram Rideout, Matthew R. Dillon, Nicholas A. Bokulich, Christian C. Abnet, Gabriel A. Al-Ghalith, Harriet Alexander, Eric J. Alm, Manimozhiyan Arumugam, Francesco Asnicar, Yang Bai, Jordan E. Bisanz, Kyle Bittinger, Asker Brejnrod, Colin J. Brislawn, C. Titus Brown, Benjamin J. Callahan, Andrés Mauricio Caraballo-Rodríguez, John Chase, Emily K. Cope, Ricardo Da Silva, Christian Diener, Pieter C. Dorrestein, Gavin M. Douglas, Daniel M. Durall, Claire Duvallet, Christian F. Edwardson, Madeleine Ernst, Mehrbod Estaki, Jennifer Fouquier, Julia M. Gauglitz, Sean M. Gibbons, Deanna L. Gibson, Antonio Gonzalez, Kestrel Gorlick, Jiarong Guo, Benjamin Hillmann, Susan Holmes, Hannes Holste, Curtis Huttenhower, Gavin A. Huttley, Stefan Janssen, Alan K. Jarmusch, Lingjing Jiang, Benjamin D. Kaehler, Kyo Bin Kang, Christopher R. Keefe, Paul Keim, Scott T. Kelley, Dan Knights, Irina Koester, Tomasz Kosciolek, Jorden Kreps, Morgan G. I. Langille, Joslynn Lee, Ruth Ley, Yong-Xin Liu, Erikka Loftfield, Catherine Lozupone, Massoud Maher, Clarisse Marotz, Bryan D. Martin, Daniel McDonald, Lauren J. McIver, Alexey V. Melnik, Jessica L. Metcalf, Sydney C. Morgan, Jamie T. Morton, Ahmad Turan Naimey, Jose A. Navas-Molina, Louis Felix Nothias, Stephanie B. Orchanian, Talima Pearson, Samuel L. Peoples, Daniel Petras, Mary Lai Preuss, Elmar Pruesse, Lasse Buur Rasmussen, Adam Rivers, Michael S. Robeson II, Patrick Rosenthal, Nicola Segata, Michael Shaffer, Arron Shiffer, Rashmi Sinha, Se Jin Song, John R. Spear, Austin D. Swafford, Luke R. Thompson, Pedro J. Torres, Pauline Trinh, Anupriya Tripathi, Peter J. Turnbaugh, Sabah Ul-Hasan, Justin J. J. van der Hooft, Fernando Vargas, Yoshiki Vázquez-Baeza, Emily Vogtmann, Max von Hippel, William Walters, Yunhu Wan, Mingxun Wang, Jonathan Warren, Kyle C. Weber, Charles H. D. Williamson, Amy D. Willis, Zhenjiang Zech Xu, Jesse R. Zaneveld, Yilong Zhang, Qiyun Zhu, Rob Knight & J. Gregory Caporaso
Nature Biotechnology volume 37, pages 852–857 (2019)


バクテリアパンゲノムの探索的解析と可視化のためのウェブベースツール PanExplorer


 パンゲノムアプローチは細菌の比較ゲノム解析や進化解析に多く用いられているが、バイオインフォマティシャンのいない生物学者にはまだ難しいため、細菌パンゲノムの探索を容易にする革新的なツールが必要である。PanExplorerは、様々なゲノム解析とレポートを提供するウェブアプリケーションであり、直感的な表示により、バクテリア・パンゲノムの理解を深めることができる。一例として、Anaplasmataceae 121株(Ehrlichia 30株、Anaplasma 15株、Wolbachia 68株を含む)のパンゲノムを作成した。
 PanExplorerはPerl CGIで書かれており、可視化のためにいくつかのJavaScriptライブラリ(hotmap.js, MauveViewer, CircosJS)に依存している。PanExplorerはhttp://panexplorer.southgreen.fr で自由に利用できる。ソースコードGitHubリポジトリhttps://github.com/SouthGreenPlatform/PanExplorer)で公開されている。PanExplorerのウェブサイトには、ドキュメントのセクションが用意されている。


Documents

https://panexplorer.southgreen.fr/cgi-bin/doc.cgi?project=Anaplasmataceae

GIthub


(Githubより)

PanExplorer は、PGAP または Roary を用いてパンゲノム解析を行い、得られた情報を、遺伝子クラスターの探索やデータの解釈を容易にするいくつかのモジュールを通して、包括的かつ容易にするものです。このアプリケーションでは、様々なレベルでインタラクティブにデータを探索できます。

(i) 存在/非存在のヒートマップとしてパンゲノムを可視化する。コア遺伝子(全株に存在)、クラウド遺伝子(アクセサリーゲノム由来の遺伝子)、ゲノム特異的遺伝子を容易に同定、区別できる。

(ii) コア遺伝子と株特異的遺伝子の物理マップは、各ゲノムごとに独立した円形のゲノム表示(Circos)として表示できる。

(iii) シンテニー解析。ゲノム間の遺伝子順序の保存性をグラフ表示で調べることができる。

(iv) 特定のクラスターを目視で確認する。


webサービス

https://panexplorer.southgreen.fr/cgi-bin/home.cgiにアクセスする。

import genomeをクリックする。


プロジェクト名、ゲノムのAccession ID(GenBankかRefSeqのID)、メールアドレスを指定する。


パンゲノム解析ツールを指定する。

Minimum identityを指定する。

Check GenBank IDsをクリックするとIDがチェックされる。

問題なければSubmitボタンがアクティブになる。Submitをクリック。

解析にはある程度時間がかかる。

出力例

Overviewと、追加で実行できる二次解析のタブに分かれている。

Overview

Pan-genome


Core-genome

Strain-Specific Genes


COGs


Searchタブ

ゲノムを選択し、そのサブセットのコアとなる遺伝子を表示する。


Syntenyタブ

クラスターをハイライト表示する。3つゲノムを選択する。

(説明より)3つのゲノム上のコア遺伝子の物理的な位置を表し、ゲノム間の遺伝子順序の保存性を評価できる。各ノードは、3つのゲノム間でコア遺伝子として定義されたクラスタに対応している。リンクは、ゲノムのリアレンズメントを推定しやすくするために、カラーグラデーションで色付けされている。マウスカーソルをノードに乗せると、クラスタの名前と対応する系統ゲノムの遺伝子が表示される(Hive Plotについて、Datavizの解説)。


Mauve Viewer


Cluster searchタブ

遺伝子名またはクラスター名を入力する。


クラスターに含まれる遺伝子数が400以下であれば系統を再構築できる。

ハプロタイプの配列数が75以下であれば、ネットワークを構築できる。

ハプロタイプ配列(SNP位置のみ)のMedian-Joining Network (MJN)


Gene Searchタブ

Searchタブはゲノムだが、Gene Searchタブでは遺伝子を検索できる。


Circosタブ


TOPページからデモとして3つのプロジェクトの結果を閲覧できます。アクセスしてみて下さい。


引用

PanExplorer: a web-based tool for exploratory analysis and visualization of bacterial pan-genomes
Alexis Dereeper,  Marilyne Summo,  Damien F Meyer
Bioinformatics, Published: 02 August 2022


関連