macでインフォマティクス

macでインフォマティクス

HTS (NGS) 関連のインフォマティクス情報についてまとめています。

gene featureを視覚化するwebサービス GSDS 2.0


遺伝子のエクソンイントロンの組成や位置などの遺伝子の特徴を視覚化することにより、生物学者アノテーションを統合し視覚的なプレゼンテーションを提供できるようになり、publication用の高品質な図の作成も支援される。したがって、FancyGene(Rambaldi and Ciccarelli、2009)、GECA(Fawal et al、2012)、FeatureStack(Frech et al、2012)、GSDraw(Wang et al、2013)、GPViz(Snajder et al、2013)、およびGenePainter(Hammesfahr et al、2013)を含むいくつかのWebサーバー/ソフトウェアが開発された。本著者らは、シーケンス、GenBankのアクセッション番号(Benson et al。、2013 )およびエクソンの位置からpublicationに適した高品質の図を生成するように設計されたGSDSを発表した。 GSDSは、毎年100万件以上のヒットがあり、機能的研究(Ye et al、2009; Wang et al、2010)および進化研究(Hu et al、2010; Yin et al、2009; Yu et al、2009)の世界中の科学者によって広く使用されている。

 GSDSユーザーからのフィードバックを受け、アップグレードされたGSDS 2.0を開発した。前のバージョンと比較して、GSDS 2.0は2つのより広く使用されているアノテーション形式をサポートし、アノテーションファイルのより包括的なサポートを提供する。生物学者がpublicationに適した図を作成できるように、GSDS 2.0は強力なインタラクティブインターフェイスを提供する。ユーザーは、最初のレンダリング後にアノテーション機能のサイズ、形状、色をカスタマイズしたり、統合されたビジュアルエディターで各要素を微調整することもできる。進化分析を容易にするために、ユーザー指定の系統樹を図に追加できる。最後に、生成された図は、ベクターグラフィック(SVGおよびPDF形式)またはラスターグラフィック(PNG形式)としてエクスポートできる。


HP

http://gsds.cbi.pku.edu.cn/index.php

help(下にlocal版のダウンロードリンクあり)

http://gsds.cbi.pku.edu.cn/Gsds_help.php


使い方

http://gsds.cbi.pku.edu.cn/index.phpにアクセスする。

f:id:kazumaxneo:20191119235132p:plain

右上からmirrorサイトも利用できます。


入力ファイルはBED5 format、GTF、GFF3に対応している。

BED5なら

geneID/transcriptID start end featureType phase(optional)

になる。詳細はhelp参照。


f:id:kazumaxneo:20191119235453p:plain

exampleデータを読み込んだ。exonic region (CDS) を1行ずつ記載する。


GenBankならaccession numberを指定するだけで良い(登録済みのデータに限られる)。

f:id:kazumaxneo:20191120001144p:plain


GTF/GFF3

f:id:kazumaxneo:20191120001525p:plain


outputを押して実行する。

f:id:kazumaxneo:20191120001705p:plain


boxやintronの線の太さ、色は下のパネルから変更できる。パラメータ変更後、redrawボタンをクリックして再描画する。

f:id:kazumaxneo:20191120002703p:plain


結果はPNGSVG、PDFでexportできる。

f:id:kazumaxneo:20191120002811p:plain


Edit figure~ボタンを押すとオンラインで編集できる。

f:id:kazumaxneo:20191120003021p:plain


ラン時にNewick formatのファイルも指定していると、系統樹を組み合わせた図を作ることができる。

f:id:kazumaxneo:20191120003713p:plain

引用
GSDS 2.0: an upgraded gene feature visualization server

Hu B, Jin J, Guo AY, Zhang H, Luo J, Gao G

Bioinformatics. 2015 Apr 15;31(8):1296-7


関連


biological sequences専用のイラストレーター IBS


 簡潔で、繊細で正確な画像は、説明だけよりも大きな利点がある。さまざまな機能要素を備えた生物学的シーケンスのグラフィカルな表現は、分子生物学的機能の調査の過程で得られた科学的発見の効率的な導入と解釈のための基本である。現在、生物学者は主にMicrosoft PowerPointAdobe Illustrator、またはPhotoshopを使用して生物学的シーケンスを図式化している。ただし、これらのソフトウェアパッケージは、画像操作の一般的な提案のために開発されたため、十分な精度のシーケンス構成図を作成するために使用することは困難である。たとえば、DNAモチーフやタンパク質ドメインなどの機能的要素のスケールは、一般的に概算されており、目でも判断される。また、これらのツールを使用する場合、機能的要素の位置も位置も、生物学的シーケンスで正確に指定することはできない。

 生物学的配列のMyDomainsの専門的なイラストレーターを提供する最初の試みは、PROSITEデータベースによって行われた(Sigrist et al、2013, link)。このツールを使用すると、タンパク質配列の機能ドメインと部位を正確なスケールで描くことができる。タンパク質ドメインのダイアグラムでは、最大6つの異なる形状と4つの異なるカラーモードがサポートされている。ただし、タンパク質ドメイングラフ(DOG)を生成する前に、機能ドメインまたはサイトの正確な位置を指定する定義済みのスクリプトを提供する必要がある。 2009年、本著者らのグループは、タンパク質グラフを段階的にプロットするためのDOG(Ren et al、2009)というソフトウェアパッケージも開発した。 DOGはタンパク質図作成用に特別に設計されたが、ヌクレオチド配列の機能要素を視覚化するために多くの研究者がそれを使用していた。ただし、DOGはヌクレオチドドメインの描画要素がないため、ヌクレオチド配列の視覚化に最適なツールではない。この点で、タンパク質とヌクレオチド配列の両方を図式化するための新しいソフトウェアパッケージの開発が待たれている。

 ここでは、生物学者がタンパク質とヌクレオチドの両方の出版品質の図を描くのを支援するillustrator of biological sequences(IBS)と呼ばれる新しいツールを紹介する。タンパク質配列とヌクレオチド配列の両方の機能的要素または調節分子を表すために、豊富なグラフィック要素が利用可能になっている。 IBSスタンドアロンパッケージはJAVAで実装され、WindowsLinuxMac OSを含む3つの主要なオペレーティングシステムをサポートしている。この強力なツールは、生物学的シーケンスを視覚化するための生物学者にとって大きな助けになると期待している。

 IBSは、タンパク質またはヌクレオチド配列の説明図を効果的に支援するデュアルモードインターフェイスを提供する。デュアルモードでは、タンパク質配列とヌクレオチド配列の両方の注釈用にさまざまな描画要素が実装される。また、より良い色の外観のために3つのカラーレンダラーを提供する。 「エクスポート」モジュールを使用して、出版品質の図を生成できる。使いやすいインターフェイスは、スタンドアロンパッケージとIBSのオンラインサービスの両方で提供されている。


HP

http://ibs.biocuckoo.org

Documentation

http://ibs.biocuckoo.org/userguide.php


インストール

download

windowsmaclinux版が用意されている。

http://ibs.biocuckoo.org/download.php

アカデミックの利用についてはフリー。商用利用を考えている場合、著者に連絡するよう記載されている(HPに連絡先リンクあり)。


使い方

ここではオンライン版について簡単に紹介する。

IBS: Illustrator for Biological Sequences からweb serverにアクセスする。

f:id:kazumaxneo:20191119024321p:plain


Demoを読み込んでみる。

f:id:kazumaxneo:20191119024422p:plain

描画された。

f:id:kazumaxneo:20191119024451p:plain

各オブジェクトはクリックして編集できる。


新しくイラストを書いてみる。まずは遺伝子やタンパク質から描いていく。左端の+をクリック。

f:id:kazumaxneo:20191119030903p:plain


ウィンドウが出てくるので、プロテインのサイズを記載。高さは25から50に変更した。

f:id:kazumaxneo:20191119031247p:plain

色やグダデーションパターン、サイズなど細かく指定できる。サイズを指定できるのが特に重要。


描画された。

f:id:kazumaxneo:20191119031249p:plain


domainを追加する。+の右隣のdraw a domainをクリック。

f:id:kazumaxneo:20191119031646p:plain

domainの領域を指定。

f:id:kazumaxneo:20191119031806p:plain


追加された。

f:id:kazumaxneo:20191119031857p:plain

すでにこのタンパク質がターゲットになっているので、位置のズレなく素早く追加できる。この辺が専用ツールの強みと言える。汎用のイラストレーターではこうは行かない。


編集するにはオブジェクトをダブルクリックするか右クリックする。ドラッグして左右に動かすこともできるが、ポジションが大雑把になってしまう。Editから数値指定で行った方が無難。

f:id:kazumaxneo:20191119032238p:plain

Editを選択。ウィンドウが再び出現する。Font sizeを14まで小さくする。

f:id:kazumaxneo:20191119032328p:plain

修正。さらにもう1つ加えた。

f:id:kazumaxneo:20191119032604p:plain

Draw sitesを選択。

f:id:kazumaxneo:20191119033632p:plain

形や線のポジションを選択する。

f:id:kazumaxneo:20191119033707p:plain


追加された。ドラッグして移動できる。

f:id:kazumaxneo:20191119033834p:plain


少し離した。

f:id:kazumaxneo:20191119034127p:plain


Cut lineを入れる。

f:id:kazumaxneo:20191119034242p:plain

ウィンドウが出てくるので、ポジションやカットの向き等を指定する。

f:id:kazumaxneo:20191119034240p:plain

900にしたので、右端に追加された。

f:id:kazumaxneo:20191119034356p:plain

テキストを組み込む。

f:id:kazumaxneo:20191119034523p:plain

追加された。

f:id:kazumaxneo:20191119034543p:plain


1アクション間違えたらUndo、1アクションやり直すならRedoボタンを使うと早い。

f:id:kazumaxneo:20191119034623p:plain

イラレと同じくヒストリーで管理しているので2アクション以上戻ることもできる。


右のコンポーネントパネルから特定のコンポーネントだけ除去したり、上位/下位配置に変更できる。

f:id:kazumaxneo:20191119034831p:plain


論文に使用されたイラストデモが20読み込めるで、これらを表示して描き方を真似すると早く学べると思います。

引用
IBS: an illustrator for the presentation and visualization of biological sequences

Liu W, Xie Y, Ma J, Luo X, Nie P, Zuo Z, Lahrmann U, Zhao Q, Zheng Y, Zhao Y, Xue Y, Ren J
Bioinformatics. 2015 Oct 15;31(20):3359-61


microbialの遺伝子コンテキストを視覚化するwebサービス MGcV


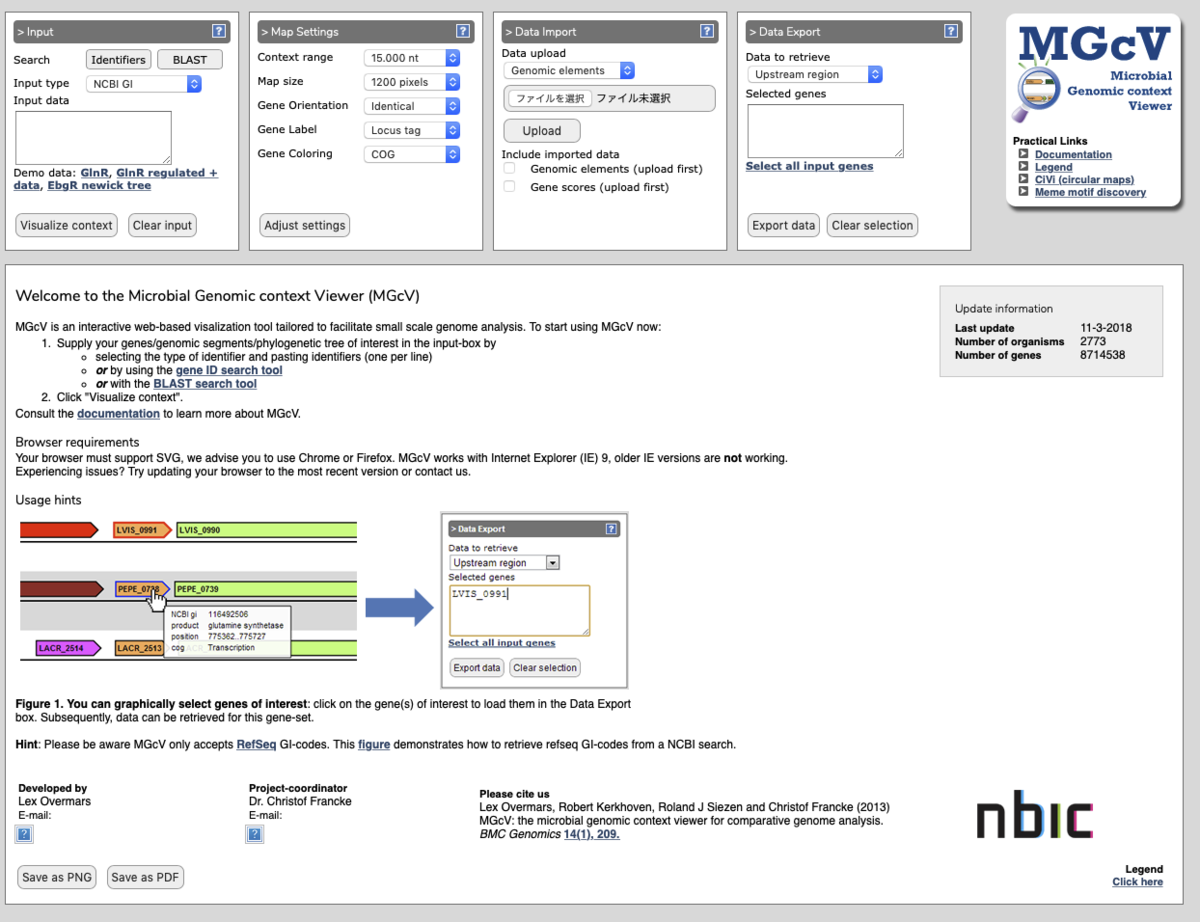
 保存された遺伝子コンテキストは、多くのタイプの比較ゲノム解析で使用される。遺伝子機能のリードを提供し、調節配列の発見を導くだけでなく、代謝ネットワークの再構築を支援するために使用さされる。 Microbial Genomic context Viewer(MGcV)は、バクテリアの手動比較ゲノムコンテキスト分析の実践を強化するために調整された、インタラクティブなWebベースのアプリケーションである。
 MGcVは、選択された任意の遺伝子セット、系統樹内の遺伝子、ゲノムセグメント、または調節エレメントのゲノムコンテキストを視覚化する、汎用性が高く使いやすいツールである。遺伝子機能のインタラクティブアノテーション、調節エレメントの発見、または遺伝子調節ネットワークのシーケンスベースの再構築などの面倒なタスクを容易にするように調整されている。 MGcVは、NCBIからPfamドメイン、細胞内位置予測、GCコンテンツなどの遺伝子配列特性などの他のアノテーションデータと、原核遺伝子に関する情報を視覚的に統合する。また、転写調節の分析と再構築において、データの収集(上流領域、ID、アノテーションなど)を促進するための遺伝子のグラフィカルな選択を可能にするインタラクティブ機能の有用性を示す。さらに、推定調節因子とそれに対応するスコアまたはRNA-seqおよびマイクロアレイ実験からのデータをアップロードし、視覚化して、(ランク付けされた)比較コンテキストマップで解釈できる。ランク付けされたマップにより、予測される調節因子と実験データを相互に照らし合わせて解釈できる。


Documentation

https://mgcv.cmbi.umcn.nl/help.html


使い方

https://mgcv.cmbi.umcn.nl にアクセスする。

f:id:kazumaxneo:20191118015013p:plain


遺伝子/ゲノム領域の識別子(identifiers)を貼り付ける。

example dataを使う。

1、左上のウィンドウにNCBI GI(リンク)をペーストする。

f:id:kazumaxneo:20191118135249p:plain

視覚化するサイズや情報を指定する。

f:id:kazumaxneo:20191118135438p:plain

視覚化された。

f:id:kazumaxneo:20191118135212p:plain


NCBI GIはバージョンによって変化するのでややこしい。不明の時はMGcV組み込みのサーチツールを使うのが早い。左上のIdentifiersをクリックするとウィンドウが出現する。このウィンドウ内でIDを検索する。ゲノムが登録されている菌の株名、=> 酵素名の手順で絞り込める。

f:id:kazumaxneo:20191118140105p:plain

表示された候補を左上のウィンドウにペーストする。


多くの領域を一度に視覚化することもできる。

f:id:kazumaxneo:20191118141614p:plain


newick formatのファイルにも対応している。ただし各ラベルはNCBI-GIになっていないといけない。

f:id:kazumaxneo:20191118141457p:plain


関連する情報をexportしてMEMEに渡すことができる。

f:id:kazumaxneo:20191118141940p:plain

テスト時は機能しなかった(*1)。

引用
MGcV: the microbial genomic context viewer for comparative genome analysis
Overmars L, Kerkhoven R, Siezen RJ, Francke C
BMC Genomics. 2013 Apr 1;14:209


関連


*1  macos10.14にてchrome使用。


GATKのgenotyping結果を反映したゲノム配列を出力する VCF2Genome


このメソッドはEAGERの機能の1つで、VCFファイルのバリアントを組み込んだFastAファイルを生成するために使用できる。 バクテリアのデータに特に有用である。この機能により、ユーザーは、ジェノタイピングの最低品質、カバレッジ、およびSNP対立遺伝子頻度を選択して、真と見なすコールを含む配列を作成できる。 より詳細な説明は論文のGenotypingの段落を参照。


EAGERマニュアル - VCF2Genome

Module description — EAGER 1.92 documentation


インストール

依存

本体 Github

#Bioconda(link)
conda install -c bioconda -y vcf2genome

vcf2genome

$ vcf2genome

VCF2Genome (v. 0.91 2017-01-13)

by Alexander Herbig (<= v0.84) and Alexander Peltzer (>v0.84)

herbig@shh.mpg.de, peltzer@shh.mpg.de


Option "-draft" is required

 -draft VAL                 : draft contains Ns where no call can be made. RefMod contains reference calls instead at

                              these positions.

 -draftname DRAFT_SEQ_NAME  : Name of the draft sequence.

 -h                         : Display this help information and exit. (default: false)

 -in VAL                    : input VCF file

 -minc MIN_COVERAGE_FOR_SNP : Minimum coverage / reads confirming the call.

 -minfreq MIN_SNP_FREQUENCY : Minimum fraction of reads supporting the called nucleotide.

 -minq MIN_QUAL_SCORE       : Minimum quality score. For UG: Phred scaled quality score. For HC genome quality score.

 -ref VAL                   : reference genome in FastA format

 -refMod VAL                : More precise uncertainty encoding. N: Not covered or ambiguous. R: Low coverage but looks

                              like Ref. a,c,t,g (lower case): Low coverage but looks like SNP.

 -uncertain VAL             : Special 1234 encoded FastA output.


    Example: java -jar VCF2Genome.jar -draft VAL -draftname DRAFT_SEQ_NAME -in VAL -minc MIN_COVERAGE_FOR_SNP -minfreq MIN_SNP_FREQUENCY -minq MIN_QUAL_SCORE -ref VAL -refMod VAL -uncertain VAL


テストラン

リファレンスFASTAと GATKなどでバリアントコールして得たVCFを指定する。また、出力のFASTA名とヘッダー名、パラメータも指定する必要がある。

git clone https://github.com/apeltzer/VCF2Genome.git
cd VCF2Genome/src/test/resources/

vcf2genome -draft output_draft.fasta -draftname "hedder_name" \
-in VCF2Genome_Test_Subset.vcf -minc 5 -minfreq 0.8 -minq 30 \
-ref draft_golden.fasta -refMod output.refMod \
-uncertain 1234_output.fasta


引用

EAGER: efficient ancient genome reconstruction

Alexander Peltzer, Günter Jäger, Alexander Herbig, Alexander Seitz, Christian Kniep, Johannes Krause, Kay Nieselt
Genome Biology volume 17, Article number: 60 (2016)


GitHub - apeltzer/VCF2Genome: A tool to create a draft genome file out of a GATK VCF file

publication品質の近傍遺伝子描画webサービス Gene Graphics


 遺伝子近傍の検査は比較ゲノミクスの不可欠な部分だが、遺伝子クラスターのpublication品質のグラフィックスを作成するツールはない。 Gene Graphicsは、このようなビジュアルを作成するための簡単なWebアプリケーションである。サポートされている入力には、National Center for Biotechnology Information遺伝子およびタンパク質識別子が含まれ、近隣情報、GenBankファイル、およびSEEDデータベースから抽出されたデータを自動的に取得する。遺伝子およびゲノムの名前、色、サイズなど、遺伝子表現は多くのパラメーターに合わせてカスタマイズできる。種間の相同な遺伝子の迅速かつユーザーフレンドリーなカスタマイズのために、遺伝子属性をコピーして貼り付けることができる。ポータブルネットワークグラフィックスとスケーラブルベクターグラフィックスに加えて、生成された表現は、タグ付けされた画像ファイル形式またはカプセル化されたPostScript、公開の標準形式としてエクスポートできる。実践的なチュートリアルがトレーニングに利用できる。


Tutorials

https://katlabs.cc/genegraphics/tutorials


使い方

https://katlabs.cc/genegraphics/descriptionにアクセスする。

f:id:kazumaxneo:20191116013313p:plain


読み込むデータを指定する。ここではFetch from NCBIを選ぶ。

f:id:kazumaxneo:20191116013736p:plain

Gene ID identifierを指定するウィンドウが出現する。

f:id:kazumaxneo:20191116013739p:plain


ここではチュートリアルと同じGenBank ID: CP001682.1(link)の5 ORFを描画する。

Organism nameをGenome locationに切り替え、Cryptobacterium curtum DSM 15641とタイプ。

f:id:kazumaxneo:20191116014900p:plain

対応するゲノムが表示されたので、こちらをクリックして選択。


1429479 から 1436151までを描画する。数値を入力してSubmitする。

f:id:kazumaxneo:20191116014843p:plain

描画された。

f:id:kazumaxneo:20191116015224p:plain


文字がORFのboxからはみ出てしまっているので、サイズを変更する。Graph settings => size settigsを選ぶ。f:id:kazumaxneo:20191116015903p:plain


横1500px、縦40pxとした。

f:id:kazumaxneo:20191116015904p:plain

修正された。

f:id:kazumaxneo:20191116024559p:plain


もう1つ追加する。Search byでProtein IDを選び、ID: ABI68735.1を追加する。

f:id:kazumaxneo:20191116023209p:plain

合計5000 bpのORFを含む領域が取り込まれる。


ORFをクリックすると、ORF毎の個別編集ができる。ここではORFの表記を下にずらす。

f:id:kazumaxneo:20191116023549p:plain

Swol_1427を下にずらした。

f:id:kazumaxneo:20191116023553p:plain

さらにもう1つ追加する。今度はSearch byでGene symbol~を選ぶ。Gene symbolはduf208、OrgansimはEggerthellaとタイプし、~DSM2243を選択した。

f:id:kazumaxneo:20191116024401p:plain

追加された。

f:id:kazumaxneo:20191116024955p:plain


IDから遺伝子名に変更。

f:id:kazumaxneo:20191116025152p:plain

Graph Settings => Gene shape => arrow on

f:id:kazumaxneo:20191116025904p:plain


Label Settings  =>Gene labels

一括で中央配置に変更。

f:id:kazumaxneo:20191116030105p:plain


図はExportから指定フォーマットで出力できる。

f:id:kazumaxneo:20191116030438p:plain


チュートリアル1では、この他にも相同なタンパク質をコードするORFの色を揃える説明などがあります。チュートリアル2-3はより実践的な内容になっています。

https://katlabs.cc/genegraphics/tutorials
引用
Gene Graphics: a genomic neighborhood data visualization web application
Katherine J Harrison, Valérie de Crécy-Lagard, Rémi Zallot

Bioinformatics. 2018 Apr 15; 34(8): 1406–1408.

マルチプルシーケンスアラインメント結果を閲覧したりフィルタリングする MView


MViewは、シーケンスデータベース検索またはマルチアライメントの結果を抽出および再フォーマットし、オプションでWebページレイアウト用のHTMLマークアップを追加するコマンドラインユーティリティである。 一般的な形式に変換するためのフィルターとしても使用できる。


HP

MView — MView

Manual

https://desmid.github.io/mview/manual/manual.html

インストール

download

http://desmid.github.io/mview/index.html#download

1行目をperlのパスに修正する。

#!/usr/bin/perl

f:id:kazumaxneo:20191114220917p:plain

ここではmview-1.66のフォルダを/usr/local/に移動し、25行を以下のように修正した。

use lib '/usr/local/mview-1.66/lib';

f:id:kazumaxneo:20191114220940p:plain


> /usr/local/mview-1.66/bin/mview -h

$ /usr/local/mview-1.66/bin/mview -h

usage: mview [options] [file...]


Option names and parameter values can generally be abbreviated. Alternative

parameter values are listed in braces {}, followed by the default value in

square brackets [].


Some options take multiple arguments which must be supplied as a comma

separated list, like '1,8,9,10'. Subranges are allowed, so you could also

write that as '1,8:10' or even '1,8..10'. Any argument must be quoted if it

contains whitespace or a wildcard that might be expanded by the shell.


Option processing can be terminated using '--'.


Input/output formats:

  -in format            Input {blast,uvfasta,clustal,fasta,pir,msf,plain,hssp,maf,multas,mips,jnetz}.

  -out format           Output {pearson,fasta,pir,plain,clustal,msf,mview,rdb}. [mview]


Main formatting options:

  -ruler on|off         Show ruler. [on]

  -alignment on|off     Show alignment. [on]

  -conservation on|off  Show clustal conservation line. [off]

  -consensus on|off     Show consensus. [off]

  -width columns        Paginate alignment in blocks of width {N,full}. [full]


Percent identity calculations and filters:

  -pcid mode            Compute percent identities with respect to {aligned,reference,hit}. [aligned]

  -reference string     Use row N or row identifier as %identity reference. [query]

  -minident N           Only report sequences with percent identity >= N compared to reference. [0]

  -maxident N           Only report sequences with percent identity <= N compared to reference. [100]

  -sort mode            Resort output by coverage or percent identity {cov,pid,cov:pid,pid:cov,none}. [none]


General row/column filters:

  -top count            Report top N hits {N,all}. [all]

  -show str[,str]       Keep rows 1..N or identifiers.

  -hide str[,str]       Hide rows 1..N or identifiers.

  -nops str[,str]       Exclude rows 1..N or identifiers from calculations.

  -range M:N,all        Display column range M:N as numbered by ruler. [all]


Molecule type:

  -moltype mol          Affects coloring and format converions {aa,na,dna,rna}. [aa]


Alignment coloring:

  -coloring mode        Basic style of coloring {none,any,identity,mismatch,consensus,group}. [none]

  -colormap name        Name of colormap to use {see manual}. [P1]

  -groupmap name        Name of groupmap to use if coloring by consensus {see manual}. [P1]

  -threshold N          Threshold percentage for consensus coloring. [70]

  -ignore mode          Ignore singleton or class groups {none,class,singleton}. [none]


Consensus coloring:

  -con_coloring mode    Basic style of coloring {none,any,identity}. [none]

  -con_colormap name    Name of colormap to use {see manual}. [PC1]

  -con_groupmap name    Name of groupmap to use if coloring by consensus {see manual}. [P1]

  -con_threshold N[,N]  Consensus line thresholds. [100,90,80,70]

  -con_ignore mode      Ignore singleton or class groups {none,class,singleton}. [none]

  -con_gaps on|off      Count gaps during consensus computations if set to 'on'. [on]


Motif colouring:

  -find pattern         Find and highlight exact string or simple regular expression or ':' delimited set of patterns.


Miscellaneous formatting:

  -label0               Switch off label {0= row number}. [set]

  -label1               Switch off label {1= identifier}. [set]

  -label2               Switch off label {2= description}. [set]

  -label3               Switch off label {3= scores}. [set]

  -label4               Switch off label {4= percent coverage}. [set]

  -label5               Switch off label {5= percent identity}. [set]

  -label6               Switch off label {6= first sequence positions: query}. [set]

  -label7               Switch off label {7= second sequence positions: hit}. [set]

  -label8               Switch off label {8= trailing fields}. [set]

  -gap char             Use this gap character. [-]

  -sequences on|off     Output sequences. [on]

  -register on|off      Output multi-pass alignments with columns in register. [on]


HTML markup:

  -html mode            Controls amount of HTML markup {head,body,data,full,off}. [off]

  -bold                 Use bold emphasis for coloring sequence symbols. [unset]

  -css mode             Use Cascading Style Sheets {off,on,file:,http:}. [off]

  -title string         Page title string.

  -pagecolor color      Page backgound color. [white]

  -textcolor color      Page text color. [black]

  -alncolor color       Alignment background color. [white]

  -labcolor color       Alignment label color. [black]

  -symcolor color       Alignment symbol default color. [#666666]

  -gapcolor color       Alignment gap color. [#666666]


Database links:

  -srs on|off           Try to use sequence database links. [off]

  -linkcolor color      Link color. [blue]

  -alinkcolor color     Active link color. [red]

  -vlinkcolor color     Visited link color. [purple]


NCBI BLAST (series 1), WashU-BLAST:

  -hsp mode             HSP tiling mode {ranked,discrete,all}. [ranked]

  -maxpval N,unlimited  Ignore hits with p-value greater than N. [unlimited]

  -minscore N,unlimited Ignore hits with score less than N. [unlimited]

  -strand strands       Report only these query strand orientations {p,m,both,*}. [both]

  -keepinserts on|off   Keep hit sequence insertions in unaligned output. [off]


NCBI BLAST (series 2), BLAST+:

  -hsp mode             HSP tiling mode {ranked,discrete,all}. [ranked]

  -maxeval N,unlimited  Ignore hits with e-value greater than N. [unlimited]

  -minbits N,unlimited  Ignore hits with bits less than N. [unlimited]

  -strand strands       Report only these query strand orientations {p,m,both,*}. [both]

  -keepinserts on|off   Keep hit sequence insertions in unaligned output. [off]


NCBI PSI-BLAST:

  -hsp mode             HSP tiling mode {ranked,discrete,all}. [ranked]

  -maxeval N,unlimited  Ignore hits with e-value greater than N. [unlimited]

  -minbits N,unlimited  Ignore hits with bits less than N. [unlimited]

  -cycle cycles         Process the N'th cycle of a multipass search {1..N,first,last,all,*}. [last]

  -keepinserts on|off   Keep hit sequence insertions in unaligned output. [off]


FASTA (U. of Virginia):

  -minopt N,unlimited   Ignore hits with opt score less than N. [unlimited]

  -strand strands       Report only these query strand orientations {p,m,both,*}. [both]


HSSP/Maxhom:

  -chain chains         Report only these chain names/numbers {A..B,1..N,first,last,all,*}. [all]


UCSC MAF:

  -block blocks         Report only these blocks {1..N,first,last,all,*}. [all]


MULTAL/MULTAS:

  -block blocks         Report only these blocks {1..N,first,last,all,*}. [all]


User defined colormap and consensus group definition:

  -colorfile file       Load more colormaps from file.

  -groupfile file       Load more groupmaps from file.


More information and help:

  -help                 This help.

  -listcolors           Print listing of known colormaps.

  -listgroups           Print listing of known consensus groups.

  -listcss              Print style sheet.


MView 1.66, Copyright (C) 1997-2019 Nigel P. Brown


実行方法

ここでは、多様な機能のうち、multiple sequence alignmentの結果を受け取り、html形式で出力する手順を中心に記載する。

mview -html head -in fasta input_alignment_file > alignment.html
  • -html <mode>   Controls amount of HTML markup {head, body, data, full, off}. [off]
  • -in <format>      Input {blast, uvfasta, clustal, fasta, pir, msf, plain, hssp, maf, multas, mips,jnetz}.
  • -out <format>    Output {pearson,fasta,pir,plain,clustal,msf,mview,rdb}. [mview]

出力
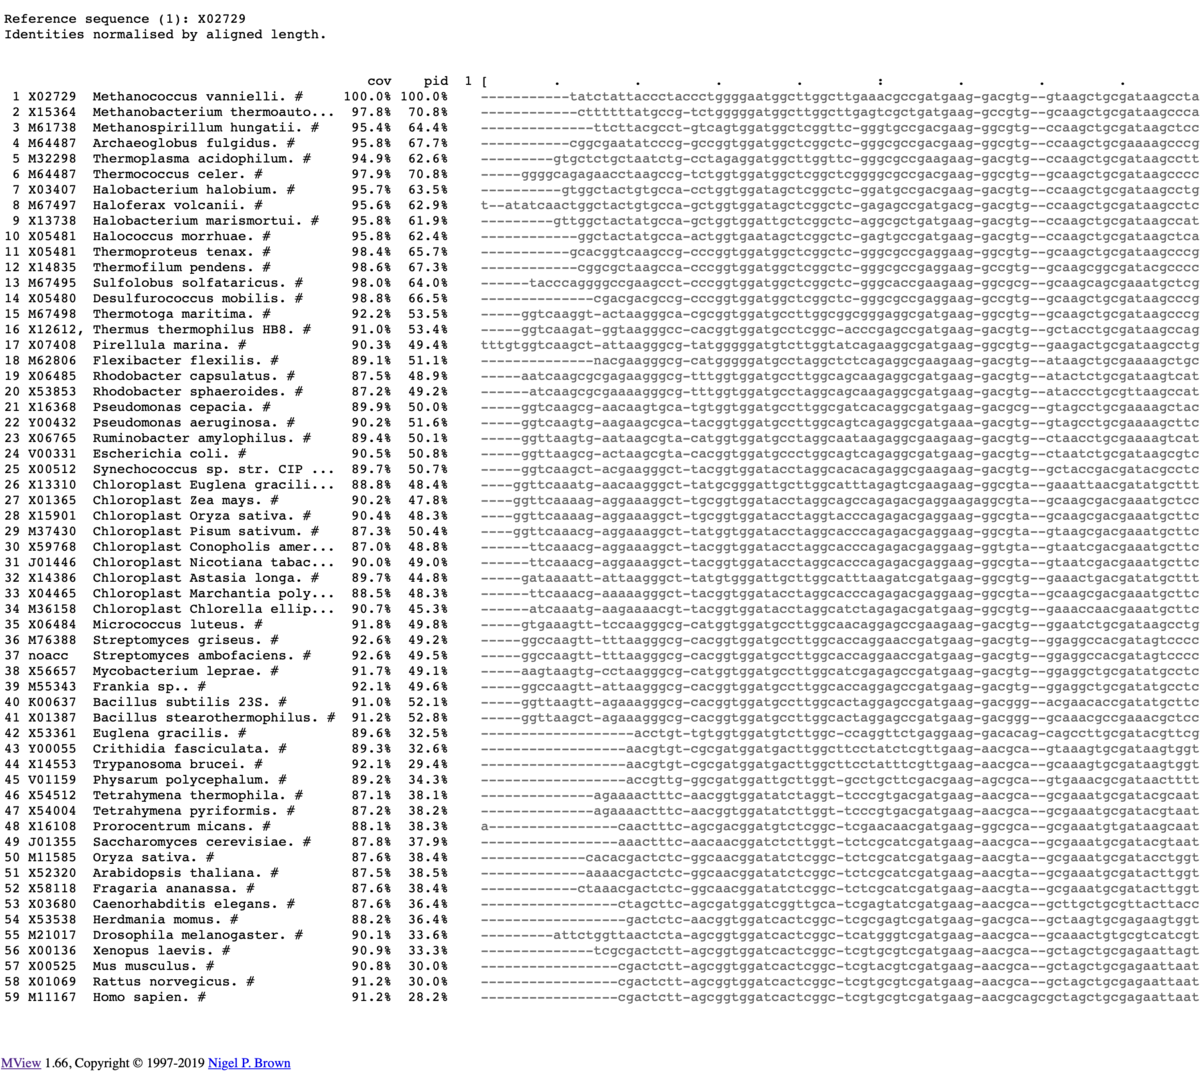
f:id:kazumaxneo:20191114224247p:plain

カラー出力

mview -html head -coloring any -bold -in fasta \
input_alignment_file > alignment.html
  • -coloring <mode>     Basic style of coloring {none, any, identity, mismatch, consensus, group}. [none]
  • -bold      Use bold emphasis for coloring sequence symbols. [unset]
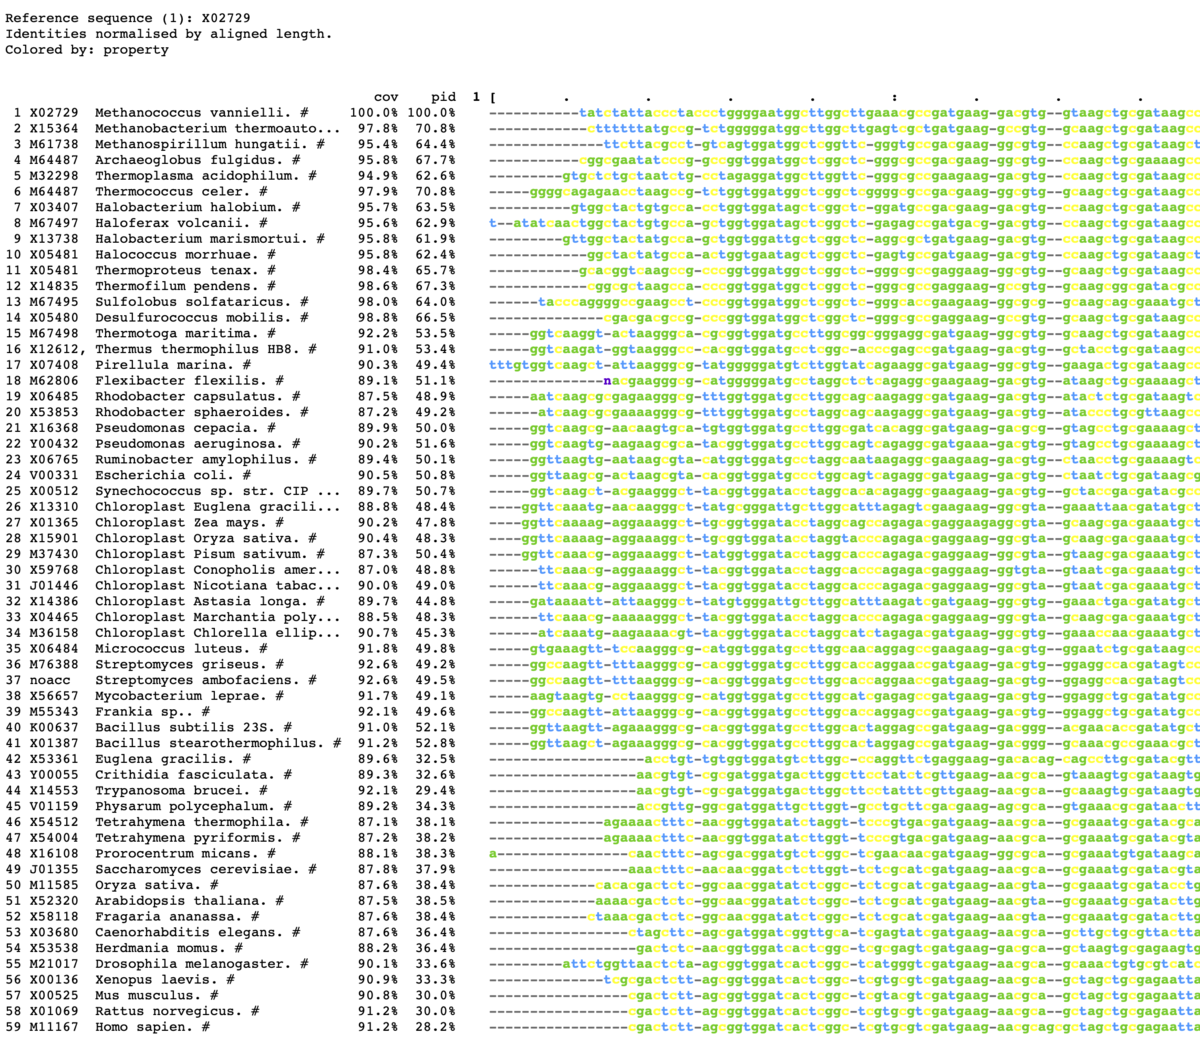
f:id:kazumaxneo:20191114224735p:plain


mview -html head -coloring any -bold -css on -in fasta \
input_alignment_file > alignment.html
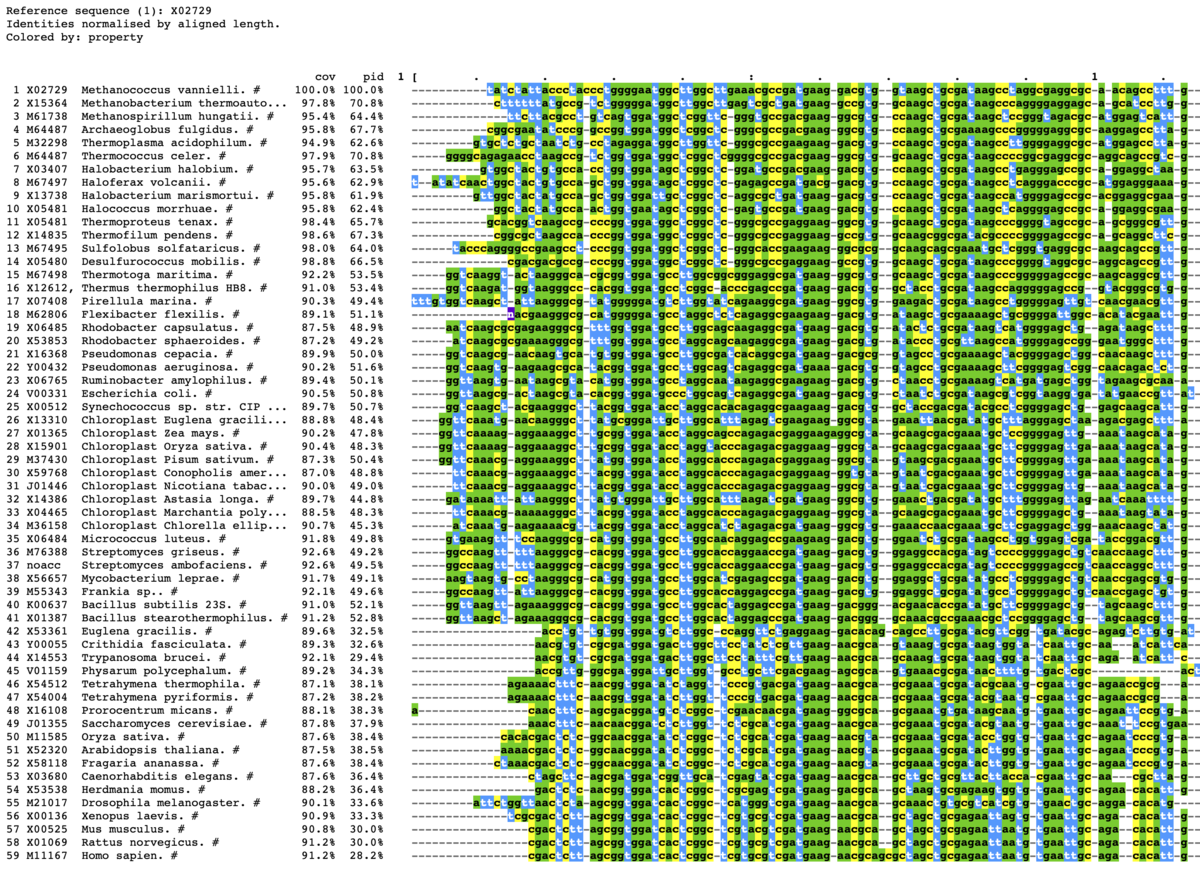
f:id:kazumaxneo:20191114224852p:plain


上から5つだけ出力する。範囲は1-100に限定する。

mview -html head -coloring identity -moltype dna \
-top 5 -range 1:100 -bold -css on \
-in fasta input_alignment_file > alignment.html
  • -top <count>     Report top N hits {N,all}. [all]
  • -range M:N,all        Display column range M:N as numbered by ruler. [all]

  • -moltype <mol>           Affects coloring and format converions {aa,na,dna,rna}. [aa]

f:id:kazumaxneo:20191114225412p:plain


コンセンサス行を追加。パーセントも指定するなら"-con_threshold <NUM>"も追加する。

mview -html head -coloring identity -moltype dna \
-top 5 -range 1:100 -bold -css on -consensus on\
-in fasta input_alignment_file > alignment.html
  • -consensus on|off     Show consensus. [off]
  • -con_threshold N[,N]    Consensus line thresholds. [100,90,80,70]

f:id:kazumaxneo:20191114233358p:plain


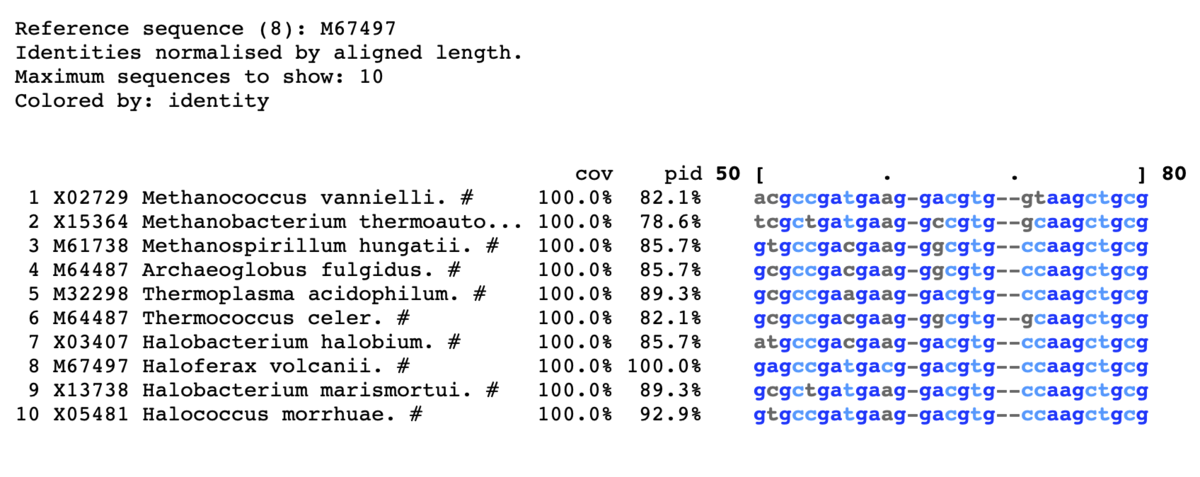
8以上に色をつける。上から10表示。

mview -html head -coloring identity -moltype dna \
-top 10 -range 50:80 -bold -css on -ref 8\
-in fasta input_alignment_file > alignment.html
  • -reference <string>     Use row N or row identifier as %identity reference. [query]
f:id:kazumaxneo:20191114234243p:plain


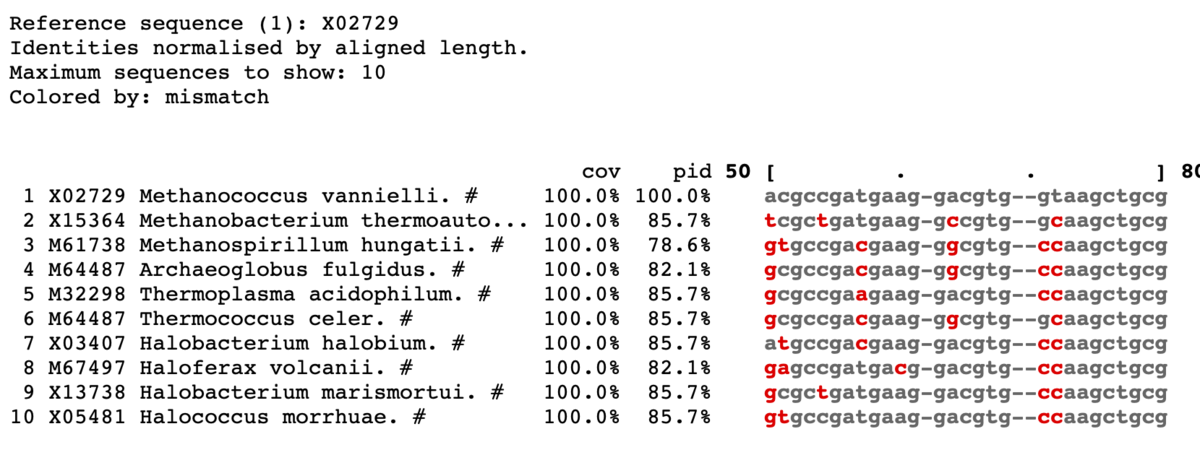
ミスマッチを赤で表示。

mview -html head -coloring identity -moltype dna -top 10 \
-range 50:80 -bold -css on -coloring mismatch -colormap red \
-in fasta input_alignment_file > alignment.html
f:id:kazumaxneo:20191114234814p:plain


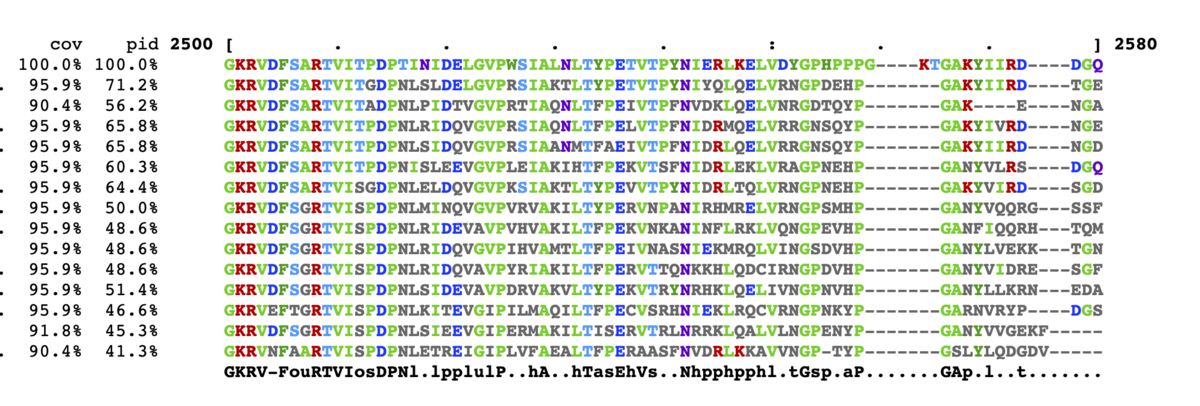
TOP15表示。コンセンサス配列を一番下に表示。90%以上。入力はprotein配列に変更。

mview -html head -coloring identity -moltype aa -top 15 \
-range 2500:2580 -bold \
-threshold 90 -consensus on -con_threshold 90 \
-in fasta input_alignment_file > alignment.html
  • -threshold <N>      Threshold percentage for consensus coloring. [70]
  • -consensus on|off     Show consensus. [off]
  • -con_threshold N[,N]    Consensus line thresholds. [100,90,80,70]
f:id:kazumaxneo:20191115000959p:plain


特定のアミノ酸配列だけカラー表示。GVP。

mview -html head -coloring identity -moltype aa -top 15 \
-range 2500:2580 -bold \
-find GVP \
-in fasta input_alignment_file > alignment.html
  • -find <pattern>     Find and highlight exact string or simple regular expression or ':' delimited set of patterns.

f:id:kazumaxneo:20191115001648p:plain

 正規表現も認識する。


コンセンサス配列をカラー表示。

mview -html head -coloring identity -moltype aa -top 15 \
-range 2500:2580 -bold \
-consensus on -con_coloring any \
-in fasta input_alignment_file > alignment.html
  • -con_coloring <mode>    Basic style of coloring {none,any,identity}. [none]

f:id:kazumaxneo:20191115002115p:plain


カラーキーをclustalに変更。

mview -html head -coloring id -colormap -moltype aa \
-css on clustal -top 15 -range 2500:2550 \
-in fasta input_alignment_file > alignment.html

f:id:kazumaxneo:20191115002547p:plain


引用

MView: a web-compatible database search or multiple alignment viewer

Brown NP, Leroy C, Sander C

Bioinformatics. 1998;14(4):380-1


関連


MAF(Multiple Alignment Format)を様々な条件でフィルタリングする MafFilter


 進化的比較ゲノム解析および集団ゲノム解析は、2つ以上のゲノム間の相同なヌクレオチド位置を記録するゲノム配列のアラインメントに基づいている。遺伝子アラインメントは3種類の文字のedit(ミスマッチ、挿入および欠失)のみを用いて記載されているが、ゲノムアラインメントは逆位、相補および転座などのリアレンジメントを可能にし、少なくとも1つのinput配列の破壊をもたらす。そのような中断がない領域はシンテニーブロックと呼ばれ、ゲノムアラインメントは相同位置のそのようなブロックのセットとして定義することができる(論文図1)。
 複数のアライメントファイルはゲノム比較データの保存と共有に使用される。それらは典型的にはMultiple Alignment Format(MAF、論文図1D参照)で書かれ、特にUCSCゲノムブラウザによって普及しているフォーマットである[ref.1]。 MAFファイルを生成するプログラムはThreaded Blockset Aligner(TBA)パッケージ[ref.2]またはLast [ref.3]のBlastZとMultiZを含む。マルチプルアラインメントはさらなる分析への入り口として役立ち、データをフィルタリングするためにはいくつかの処理ステップ、特に低クオリティ領域の除去が必要である。さらに、多くの下流解析ツールは単一のシンテニックブロックのみを入力として取り込むため、グローバルアラインメントをFastaやPhylipなどの外部フォーマットで複数のアラインメントファイルにエクスポートする必要がある。この変換は、しばしば、さらなる解析パイプラインで必要とされるかもしれないオリジナルのゲノム座標のような情報を失うという犠牲を払って行われる。この問題を解決するには、すべての分析結果を統合するデータベースを作成する必要がある[ref.4]。しかしながらこれは面倒なプロセスである。

 ここでは、複数のアライメントファイルの処理と解析を容易にする新しいプログラムを紹介する。プログラムは、ユーザーが自分の分析パイプラインを定義し、入力MAFファイルを効率的に処理することを可能にする。各シンテニーブロックは別々に処理され、ユーザによって以前に定義された一連のフィルタを通過する(論文図2)。各フィルタは、アライメントのクリーニングや関連する統計の計算など、事前定義されたタスクを実行し、最終的に変更されたシンテニーブロックを次のフィルタに渡す。プログラムの出力は、通常1つまたは複数のMAFファイル、あるいはFastaやPhylipのような外部フォーマットの複数の配置ファイルである。さらに、このプログラムは、系統発生分析が含まれる場合は、スプレッドシートファイル、さらにはツリーファイルに統計結果を出力することができる。 MafFilterは、ゲノム座標やクオリティスコアなどの配列メタデータを内部的に扱い、それによって最終結果の分析と外部情報源との統合を容易にする。

MafFilter

https://jydu.github.io/maffilter/

manual

http://biopp.univ-montp2.fr/manual/pdf/maffilter/v1.0.0/maffilter.pdf


  MafFilterは、UCSCなどで使われてるMAF(Multiple Alignment Format)フォーマットのアラインメントの分析ツール。 MAFファイルやfastaファイルを入力とし、さまざまなフィルタリングとフォーマット変換を行うことができる。MAFファイルに一連の「フィルタ」を適用することで、ゲノム座標や品質スコアなどの関連するメタデータをクリーニングし、データとコンピュータ統計を抽出する。また、アライメントを処理して、低品質だったり、あいまいだったり、マスクされた領域を削除できる。結果はFastaやClustalなどのフォーマットで、単一または複数のアラインメントファイルにエクスポートできる。


mafTools

GitHub - dentearl/mafTools: Bioinformatics tools for dealing with Multiple Alignment Format (MAF) files.


インストール

本体 Github

download

http://hgdownload.cse.ucsc.edu/admin/exe/

#bioconda (link)
conda install ucsc-maffilter -c bioconda -y

> mafFilter -h

$ mafFilter

mafFilter - Filter out maf files. Output goes to standard out

usage:

   mafFilter file(s).maf

options:

   -tolerate - Just ignore bad input rather than aborting.

   -minCol=N - Filter out blocks with fewer than N columns (default 1)

   -minRow=N - Filter out blocks with fewer than N rows (default 2)

   -maxRow=N - Filter out blocks with >= N rows (default 100)

   -factor - Filter out scores below -minFactor * (ncol**2) * nrow

   -minFactor=N - Factor to use with -minFactor (default 5)

   -minScore=N - Minimum allowed score (alternative to -minFactor)

   -reject=filename - Save rejected blocks in filename

   -needComp=species - all alignments must have species as one of the component

   -overlap - Reject overlapping blocks in reference (assumes ordered blocks)

   -componentFilter=filename - Filter out blocks without a component listed in filename 

   -speciesFilter=filename - Filter out blocks without a species listed in filename 


準備

 ここではminimap2 = > paftoolsでmafを得た。

minimap2 --cs=long -cx asm5 ref.fa contigs.fa > alignment.paf
paftools.js view -f maf alignment.paf > alignment.maf

#LASTの場合
lastdb -cR01 db ref.fa

#(*1)
echo "##maf version=1" > alignment.maf
lastal db contigs.fa >> alignment.maf

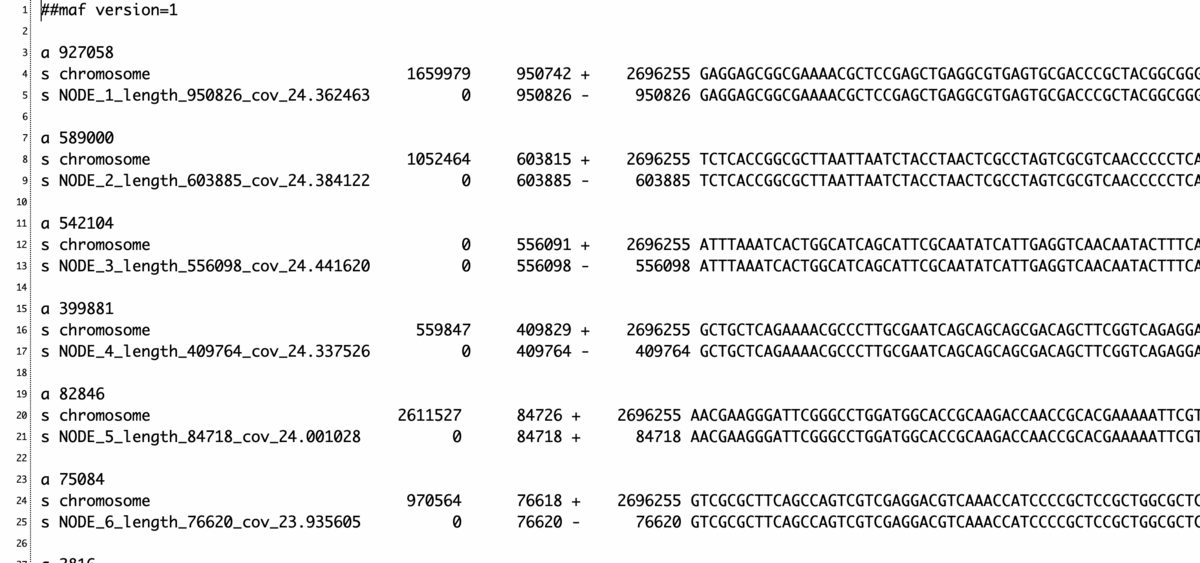
MAFファイル

f:id:kazumaxneo:20191113224125p:plain


実行方法

 入力のmafを指定する。例えば1000bp以上のアラインメントのみ出力する。

mafFilter -minCol=1000 alignment.maf > output.maf 


参考

maf-convert(LAST紹介)でsam(v1.3)やhtml形式に変換できる。

#samに変換
maf-convert sam output.maf >output.sam

#HTMLに変換
maf-convert html output.maf >output.hmtl

引用

MafFilter: a highly flexible and extensible multiple genome alignment files processor

Julien Y Dutheil, Sylvain Gaillard,  Eva H Stukenbrock
BMC Genomics 2014 15:53


関連


PAF => MAF変換


*1

##mafがないと怒られるので、つけてからランした。