macでインフォマティクス

macでインフォマティクス

HTS (NGS) 関連のインフォマティクス情報についてまとめています。

IGVが重い時のtips


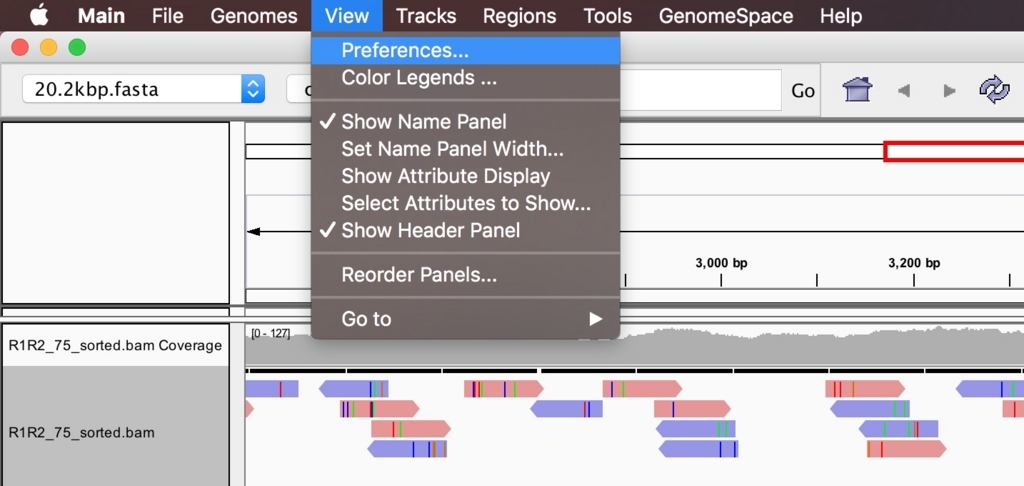
IGVにbamファイルを読み込むと重くて困ることがある。表示を軽くするためのtipsを書いておく。


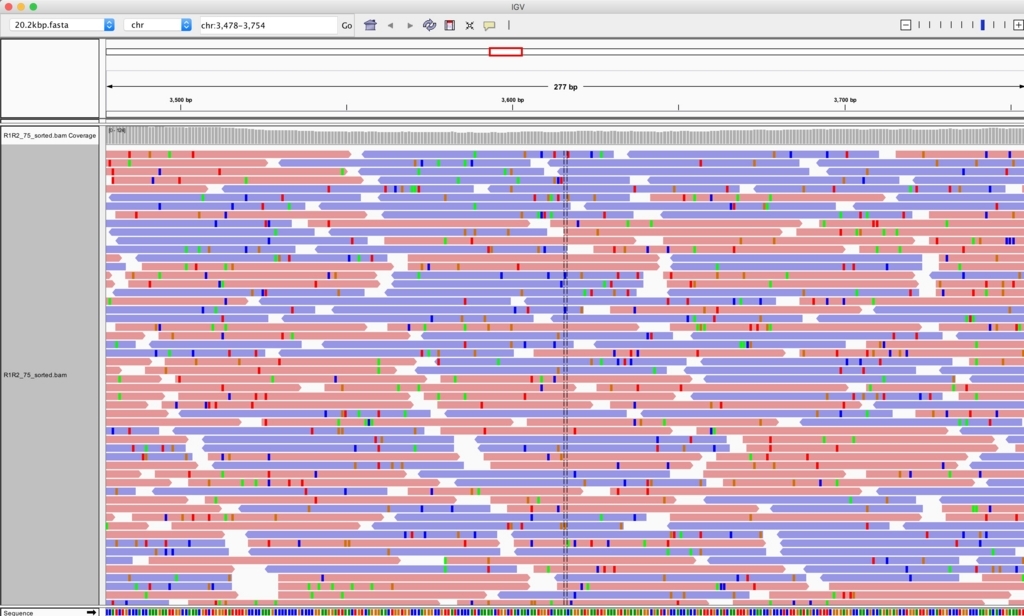
bamを読み込んでリードが見えるまで拡大した状態。

f:id:kazumaxneo:20170722115958j:plain


view -> Preference

f:id:kazumaxneo:20170722120151j:plain


赤枠部分を以下のように修正。

f:id:kazumaxneo:20170722122106j:plain


リードがダウンサンプリングされ、動作が軽くなった。

f:id:kazumaxneo:20170722122822j:plain


まずvisiblity range threshold (kb) だが、この値はリードが表示されるようになるサイズを規定している。値を小さくすると、メモリーにキャッシュされるリード量が減り動作が高速化する (10kbなら10kb以下の縮尺にならないとリードを読み込まない)。またリードの表示数を調整するため、Downsample readsの項目を"max read count => 1"、"per window size (bases) => 100にして、100bpに1リードの割合までデータ減らして表示している。

ただしリードを減らしすぎるとレアな変異などのイベントが見えなくなってしまう。減らす場合、10リードくらいにとどめておく。


max read count を1から10に変更した。

f:id:kazumaxneo:20170722123546j:plain

このようになった。100-bpあたり10リードぐらいあるのが見て取れる。

f:id:kazumaxneo:20170722123643j:plain

このくらいの数ならmacbook airなどのlaptopでも軽快に動作すると思われる。


そのほか下のオプション設定を追加しても良いかもしれない。

f:id:kazumaxneo:20170722131439j:plain

Filter duplicate readsにチェックをつけると、PCR duplicateと思われるリードが表示されなくなる。Filter secondary alignmentsにチェックをつけると、複数のアライメント部位を持つリードについては、アライメントスコアがベスト以外のアライメントが表示されなくなる。

center lineも必要なければチェックを外して、中央の破線を消している。そのほかshow soft-clipped basesとshow center lineなどのチェックを外している。indel周辺などミスアライメントが補正できなかった部位はミスアライメントが多発しており、そういった部位のリードはsoft-clipしてマッピングされている。soft-clipされたリードの領域を確認したければチェックをつける。


おまけ

リードが多すぎて見づらい時は、画面を右クリックしてCollapsedを選ぶとリードが圧縮され見やすくなります。


bamからbigWigとWiggle Formatに変換するツール

2019 3/20 誤字修正

2021 12/23 コマンド修正

2023/10/01追記


bamからwiggleファイルに変換してviewerに取り込むと、カバレッジtrackとして表示できる。ただしそれにはsamtoolsのpileupを使いbamからwiggleファイルを作る必要があり、作り方がやや面倒だった。現在では、コマンド一発でwiggleファイルを作るツールが公開されている。このツールを使ってbigwig/wiggleに変換し、IGVにカバレッジtrackを追加する流れを書いておく。


インストール

wiggleとbigwigに変換するツール

#bioconda 
mamba install -c bioconda -y ucsc-wigtobigwig
mamba install -c bioconda -y bam2wig

#2021 2/13 追記こちらを入れておく
mamba install -c bioconda jvarkit-bam2wig

https://github.com/MikeAxtell/bam2wig

バイナリなので、condaを使わない場合もpathを通して実行権を与えるだけでランできる。ただしbigwigに変換するには、下のリンクからwigtobigwigツールをダウンロードしてパスを通しておく必要がある。wigtobigwigがないと、wiggleファイルだけ作られる。


wigtobigwigのダウンロード - unix

Index of /admin/exe/linux.x86_64


wigtobigwigのダウンロード - mac OSX

bam2wig (linux)

 > wigToBigWig

$ wigToBigWig

wigToBigWig v 4 - Convert ascii format wig file (in fixedStep, variableStep

or bedGraph format) to binary big wig format.

usage:

   wigToBigWig in.wig chrom.sizes out.bw

Where in.wig is in one of the ascii wiggle formats, but not including track lines

and chrom.sizes is a two-column file/URL: <chromosome name> <size in bases>

and out.bw is the output indexed big wig file.

If the assembly <db> is hosted by UCSC, chrom.sizes can be a URL like

  http://hgdownload.cse.ucsc.edu/goldenPath//bigZips/.chrom.sizes

or you may use the script fetchChromSizes to download the chrom.sizes file.

If not hosted by UCSC, a chrom.sizes file can be generated by running

twoBitInfo on the assembly .2bit file.

options:

   -blockSize=N - Number of items to bundle in r-tree.  Default 256

   -itemsPerSlot=N - Number of data points bundled at lowest level. Default 1024

   -clip - If set just issue warning messages rather than dying if wig

                  file contains items off end of chromosome.

   -unc - If set, do not use compression.

   -fixedSummaries - If set, use a predefined sequence of summary levels.

   -keepAllChromosomes - If set, store all chromosomes in b-tree.

> bam2wig.sh -h

$ bam2wig.sh -h

Usage: bam2wig [options] Files

  Options:

    -bg, --bedgraph

      Produce a BED GRAPH instead of a WIGGLE file.

      Default: false

    --display

      What kind of data should we display ?

      Default: COVERAGE

      Possible Values: [COVERAGE, CLIPPING, INSERTION, DELETION, READ_GROUPS, CASE_CTRL]

    --filter

      A filter expression. Reads matching the expression will be filtered-out. 

      Empty String means 'filter out nothing/Accept all'. See https://github.com/lindenb/jvarkit/blob/master/src/main/resources/javacc/com/github/lindenb/jvarkit/util/bio/samfilter/SamFilterParser.jj 

      for a complete syntax.

      Default: mapqlt(1) || MapQUnavailable() || Duplicate() || FailsVendorQuality() || NotPrimaryAlignment() || SupplementaryAlignment()

    -f, --format

      `Printf` Format for the values. see 

      https://docs.oracle.com/javase/tutorial/java/data/numberformat.html . 

      Use "%.01f" to print an integer. "%e" for scientific notation.

      Default: %.3f

    -t, --header

      print a UCSC custom track header: something lile track type=track_type 

      name="__REPLACE_WIG_NAME__" description="__REPLACE_WIG_DESC__". Use 

      `sed` to replace the tokens. e.g: `sed 

      '/^track/s/__REPLACE_WIG_NAME__/My data/'`

      Default: false

    -h, --help

      print help and exit

    --helpFormat

      What kind of help. One of [usage,markdown,xml].

    --region, --interval

      Limit analysis to this interval. An interval as the following syntax : 

      "chrom:start-end" or "chrom:middle+extend"  or "chrom:start-end+extend" 

      or "chrom:start-end+extend-percent%".A program might use a Reference 

      sequence to fix the chromosome name (e.g: 1->chr1)

    --mindepth, --mindp

      When using display READ_GROUPS, What is the minimal read depth that 

      should be considered ?

      Default: 0

    -o, --output

      Output file. Optional . Default: stdout

    --partition

      When using display READ_GROUPS, how should we partition the ReadGroup ? 

      Data partitioning using the SAM Read Group (see 

      https://gatkforums.broadinstitute.org/gatk/discussion/6472/ ) . It can 

      be any combination of sample, library....

      Default: sample

      Possible Values: [readgroup, sample, library, platform, center, sample_by_platform, sample_by_center, sample_by_platform_by_center, any]

    --pedigree, -ped

      Pedigree file for CASE_CTRL. A pedigree is a text file delimited with 

      tabs. No header. Columns are (1) Family (2) Individual-ID (3) Father Id 

      or '0' (4) Mother Id or '0' (5) Sex : 1 male/2 female / 0 unknown (6) 

      Status : 0 unaffected, 1 affected,-9 unknown

    --percentile

      How to group data in the sliding window ?

      Default: AVERAGE

      Possible Values: [MIN, MAX, MEDIAN, AVERAGE, RANDOM, SUM]

    --version

      print version and exit

    -s, --windowShift

      window shift

      Default: 25

    -w, --windowSize

      window size

      Default: 100


ラン

bamからwiggleファイルを出力。

bam2wig.sh input.bam -o out.wig

#追記 bam => bigwig (deeptools); biwgwig形式で書き出すには-of bigwigを指定
bamCoverage --bam input.bam -o output.bw -of bigwig --binSize=10 --minMappingQuality 10 --numberOfProcessors=max

bam2wig.shで使いそうなオプション

-r  : Limit analysis to specified read group

-l : Minimum size of read to report. Default: no minimum.

-L : Maximum size of read to report. Default: no maximum.

-c  : Limit analysis to the indicated locus.

-m : Count each as (1/(n mapped reads)) * 1E6. In other words, normalize to reads per million.

計算が終わると、bamのあるディレクトリにbamファイル名のディレクトリが追加される。その中にbigwigとwig形式のファイルが作られる。


IGVで表示する。まずbamを取り込む。

igv -g input.fasta input.bam

f:id:kazumaxneo:20170720151839j:plain

IGVが起動してbamが表示された。


続いてFIle -> Load From filesからbigwigファイルかwiggleファイルを追加する。


カバレッジが深い部位があると変化が見えにくい。その場合、パネルの左側で右クリックし、scaleをautoに変更する。

f:id:kazumaxneo:20170720151202j:plain


track のheightも変更する。ここでは250にした。

f:id:kazumaxneo:20170720151301j:plain

カバレッジ変化が見やすくなった。

f:id:kazumaxneo:20170720151927j:plain


 bigwigはバイナリだが、wiggleファイルはテキストファイルになる。下はwiggle変換ツールで作ったwiggleファイルの中身を見たものである。

variableStep chrom=AP017303.1 span=90

390 2

variableStep chrom=AP017303.1 span=2

522 2

variableStep chrom=AP017303.1 span=87

524 4

variableStep chrom=AP017303.1 span=1

611 5

variableStep chrom=AP017303.1 span=2

612 3

variableStep chrom=AP017303.1 span=4

614 1

variableStep chrom=AP017303.1 span=83

618 3

variableStep chrom=AP017303.1 span=7


IGVでこの部位のリードを見てみる。

f:id:kazumaxneo:20170720144929j:plain矢印部分がwiuggleファイルで表記されている部位である。


左側を拡大する。

f:id:kazumaxneo:20170720145200j:plain

wiglgleでは

variableStep chrom=AP017303.1 span=90

390 2

となっている。つまり390からspanの90ntだけカバレッジ1の領域が続くことを表している。


wiggle formatの詳細はUCSCのリンクを確認してください。

Genome Browser Wiggle Track Format


上で説明したように、deeptoolsのbamCoverageを使う方法もある。bamCoverageならwigでもbigwigでも書き出せる。

引用

https://github.com/MikeAxtell/bam2wig


Biostars

https://webcache.googleusercontent.com/search?q=cache:VrSkb-8q6SMJ:https://www.biostars.org/p/2699/+&cd=1&hl=ja&ct=clnk&gl=jp


eukaryotesのアノテーションツール Augustus


Augustusはblast2goでも使われているeukaryotesのアノテーションツール。既存の他の手法と比較しても精度が高い手法と述べられている(検証リンク)。高速なwebサーバー版と、RNA-seqのbamファイルを指定してexon-intron情報を与え、予測精度を上げるlocal版がある。このbamによる支援機能はblast2goにも取り込まれている。

 local版はbinaryのみ提供されている。ただしmac OSXでは動かない。unixマシンやunixサーバーを用意する必要がある。


webサーバー版

Augustus: job submission


local版(breakerとaugustus両方必要)

http://bioinf.uni-greifswald.de/augustus/binaries/


ポスター

http://bioinf.uni-greifswald.de/bioinf/publications/pag2015.pdf


レーニング済みゲノム一覧 (README.TXT)

http://bioinf.uni-greifswald.de/augustus/binaries/README.TXT

 近縁なゲノムであれば使えるらしい。例えば哺乳類であればヒトのトレーニングデータを使えると書かれている。


bamはtophatなどで作る。


引用


アセンブル結果をCore gene setの検出数で評価する BUSCO

2018 1/9 version3のコマンドを最後に追記

2019 2/24 論文追記

2019 7/5  verrsion3向けに説明をアップデート

2019 11/24 論文追記

2019 12/26 v4インストール追記

2020 3/26 v4 追記

2020 6/15 構成を変更

2020 7/7 v4 のtrancrripts の説明が間違っていたのを修正

2020 7/22 誤字修正

2020 8/26 docker link追記2020 9/27 最新の情報を一番上に移動

2021 2/5 busco5のインストール追記,  dockerのコマンド修正


 ゲノムのアセンブルやde novo transcriptomeの評価手法の1つに、Core gene setがアセンブルされた配列の中にどれだけあるか調べる方法がある(core genesは構成的に発現していると考える)。そのようなツールとしてCEGMAがよく知られている。CEGMAはversion2.5までアップーデートされていたが、2015年にはその後継のBUSCOが発表され、CEGMAはサポートが中止された。BUSCOはCEGMA3.0とも言うべきツールで、CEGMAより随分高速化されている(CEGMAサポート停止の経緯 Goodbye CEGMA, hello BUSCO! — ACGT)。ここではBUSCOを紹介する。

 BUSCOは、90%以上の種でsingle copy orthologousな遺伝子をcore geneとして定義し、それをデータベースにしてクエリー配列を検索する。100%でなく90パーセントで線を引いたのは、一部の種ではcore geneが複製したり、アセンブルが不完全で抜けているため見つからなかったなどの理由で100%保存にできなかったためらしい。そのため90という数値に生物的な意味はないが、core geneヒット数が90パーセントを大きく割るようならおそらくアセンブルが不完全と判断できる。


公式ページ

https://busco.ezlab.org

ランマニュアル

https://busco.ezlab.org/busco_userguide.html


インストール

GitLab

#bioconda (link)バージョン指定なしなら最新の4が入る(テスト時はバージョン指定しないとうまく入らなかった)
mamba create -n busco4 python=3.7 -y
conda activate busco4
mamba install -c bioconda -c conda-forge busco==4.1.3 -y

#v5 (link)2021 5/19現在5.1.2が最新
mamba create -n busco5 python=3.7 -y
conda activate busco5
mamba install -c bioconda -c conda-forge busco==5.1.2 -y

#docker (dockerhub link)(v4 latest)
docker pull ezlabgva/busco:v4.1.2_cv1
#run
docker run -itv $PWD:/data -w /data --rm ezlabgva/busco:v4.1.2_cv1

> busco -h

$  busco -h

usage: busco -i [SEQUENCE_FILE] -l [LINEAGE] -o [OUTPUT_NAME] -m [MODE] [OTHER OPTIONS]


Welcome to BUSCO 4.0.5: the Benchmarking Universal Single-Copy Ortholog assessment tool.

For more detailed usage information, please review the README file provided with this distribution and the BUSCO user guide.


optional arguments:

  -i FASTA FILE, --in FASTA FILE

                        Input sequence file in FASTA format. Can be an assembled genome or transcriptome (DNA), or protein sequences from an annotated gene set.

  -c N, --cpu N         Specify the number (N=integer) of threads/cores to use.

  -o OUTPUT, --out OUTPUT

                        Give your analysis run a recognisable short name. Output folders and files will be labelled with this name. WARNING: do not provide a path

  --out_path OUTPUT_PATH

                        Optional location for results folder, excluding results folder name. Default is current working directory.

  -e N, --evalue N      E-value cutoff for BLAST searches. Allowed formats, 0.001 or 1e-03 (Default: 1e-03)

  -m MODE, --mode MODE  Specify which BUSCO analysis mode to run.

                        There are three valid modes:

                        - geno or genome, for genome assemblies (DNA)

                        - tran or transcriptome, for transcriptome assemblies (DNA)

                        - prot or proteins, for annotated gene sets (protein)

  -l LINEAGE, --lineage_dataset LINEAGE

                        Specify the name of the BUSCO lineage to be used.

  -f, --force           Force rewriting of existing files. Must be used when output files with the provided name already exist.

  --limit REGION_LIMIT  How many candidate regions (contig or transcript) to consider per BUSCO (default: 3)

  --long                Optimization mode Augustus self-training (Default: Off) adds considerably to the run time, but can improve results for some non-model organisms

  -q, --quiet           Disable the info logs, displays only errors

  --augustus_parameters AUGUSTUS_PARAMETERS

                        Pass additional arguments to Augustus. All arguments should be contained within a single pair of quotation marks, separated by commas. E.g. '--param1=1,--param2=2'

  --augustus_species AUGUSTUS_SPECIES

                        Specify a species for Augustus training.

  --auto-lineage        Run auto-lineage to find optimum lineage path

  --auto-lineage-prok   Run auto-lineage just on non-eukaryote trees to find optimum lineage path

  --auto-lineage-euk    Run auto-placement just on eukaryote tree to find optimum lineage path

  --update-data         Download and replace with last versions all lineages datasets and files necessary to their automated selection

  --offline             To indicate that BUSCO cannot attempt to download files

  --config CONFIG_FILE  Provide a config file

  -v, --version         Show this version and exit

  -h, --help            Show this help message and exit

  --list-datasets       Print the list of available BUSCO datasets


version4のラン方法

1、利用できるデータベースを確認

busco --list-datasets


 2、ラン

ここではeukaryota_odb10データベースを指定する。

#genome
busco -m geno -i genome.fasta -o out_dir -l eukaryota_odb10 -c 20

#transcriptome
busco -m tran -i transcriptome.fasta -o out_dir -l eukaryota_odb10 -c 20

#proteome
busco -m prot -i proteome.fasta -o out_dir -l eukaryota_odb10 -c 20
  • -m    Specify which BUSCO analysis mode to run.
    There are three valid modes:
    - geno or genome, for genome assemblies (DNA)
    - tran or transcriptome, for transcriptome assemblies (DNA)
     - prot or proteins, for annotated gene sets (protein)
  • -c   Specify the number (N=integer) of threads/cores to use.


2021 08/14

version5は改良点が多いので別にまとめています。更新されたデータベースを使っており、真菌などではかなり結果が変わる可能性があります。詳しくは論文を読んでください。


引用

BUSCO: assessing genome assembly and annotation completeness with single-copy orthologs
Felipe A. Simão, Robert M. Waterhouse, Panagiotis Ioannidis, Evgenia V. Kriventseva, and Evgeny M. Zdobnov
Bioinformatics, published online June 9, 2015


BUSCO: Assessing Genome Assembly and Annotation Completeness
Seppey M, Manni M, Zdobnov EM

Methods Mol Biol. 2019;1962:227-245. doi: 10.1007/978-1-4939-9173-0_14


関連

アセンブリmetricsを調べるツールには、TransrateやDRAPなどもあります。DRAPにはBUSCOも取り込まれています。


gVolanteではBUSCOv4とv5が使えるようになっています。

web上で簡単に使うことができます。


Insect Genomics

Using BUSCO to Assess Insect Genomic Resources

https://link.springer.com/protocol/10.1007/978-1-4939-8775-7_6


追記

Niwa Ryoさんがv4の使い方を説明されています。


===========================================================

以下は古いバージョンの情報

公式ページ 解析対象の生物に応じてHPからデータベースをダウンロードする。

=> バージョン4では指定データベースが自動ダウンロードされるため、手動での出すんロードは不要になっています。一番下のversion4を確認して下さい。

https://busco.ezlab.org

f:id:kazumaxneo:20180410124024j:plain

HPからはマニュアルもダウンロードできるようになっている。 


インストール

v4を導入

#2019 12/26追記 v4
conda install -c bioconda -y busco


#homebrew(インストール未確認)
brew install busco

*CEGMAもbrewでインストール可能。

VMのイメージもあります(リンク)。 

 > run_BUSCO.py -h

# run_BUSCO.py -h

usage: python BUSCO.py -i [SEQUENCE_FILE] -l [LINEAGE] -o [OUTPUT_NAME] -m [MODE] [OTHER OPTIONS]


Welcome to BUSCO 3.0.2: the Benchmarking Universal Single-Copy Ortholog assessment tool.

For more detailed usage information, please review the README file provided with this distribution and the BUSCO user guide.


optional arguments:

  -i FASTA FILE, --in FASTA FILE

                        Input sequence file in FASTA format. Can be an assembled genome or transcriptome (DNA), or protein sequences from an annotated gene set.

  -c N, --cpu N         Specify the number (N=integer) of threads/cores to use.

  -o OUTPUT, --out OUTPUT

                        Give your analysis run a recognisable short name. Output folders and files will be labelled with this name. WARNING: do not provide a path

  -e N, --evalue N      E-value cutoff for BLAST searches. Allowed formats, 0.001 or 1e-03 (Default: 1e-03)

  -m MODE, --mode MODE  Specify which BUSCO analysis mode to run.

                        There are three valid modes:

                        - geno or genome, for genome assemblies (DNA)

                        - tran or transcriptome, for transcriptome assemblies (DNA)

                        - prot or proteins, for annotated gene sets (protein)

  -l LINEAGE, --lineage_path LINEAGE

                        Specify location of the BUSCO lineage data to be used.

                        Visit http://busco.ezlab.org for available lineages.

  -f, --force           Force rewriting of existing files. Must be used when output files with the provided name already exist.

  -r, --restart         Restart an uncompleted run. Not available for the protein mode

  -sp SPECIES, --species SPECIES

                        Name of existing Augustus species gene finding parameters. See Augustus documentation for available options.

  --augustus_parameters AUGUSTUS_PARAMETERS

                        Additional parameters for the fine-tuning of Augustus run. For the species, do not use this option.

                        Use single quotes as follow: '--param1=1 --param2=2', see Augustus documentation for available options.

  -t PATH, --tmp_path PATH

                        Where to store temporary files (Default: ./tmp/)

  --limit REGION_LIMIT  How many candidate regions (contig or transcript) to consider per BUSCO (default: 3)

  --long                Optimization mode Augustus self-training (Default: Off) adds considerably to the run time, but can improve results for some non-model organisms

  -q, --quiet           Disable the info logs, displays only errors

  -z, --tarzip          Tarzip the output folders likely to contain thousands of files

  --blast_single_core   Force tblastn to run on a single core and ignore the --cpu argument for this step only. Useful if inconsistencies when using multiple threads are noticed

  -v, --version         Show this version and exit

  -h, --help            Show this help message and exit


注意

以下は旧バージョンの解説です。最新のv4の使い方は上のversion4を見てください。データベースの手動ダウンロードは必要なくなっています。

データベース

解析には、Core geneのデータベースを用意する必要がある。データセットは以下のリンクからダウンロードする。バクテリアも用意されている。


シロイヌナズナのデータなら陸上植物のデータベースを使う。wgetでダウンロードする。

wget http://busco.ezlab.org/v2/datasets/embryophyta_odb9.tar.gz
tar -zxvf embryophyta_odb9.tar.gz

ダウンロードが終わったら解凍する。遺伝子リストは解凍したディレクトリのinfo/~info.txt.gzに保存されている。中身を見てみる。

user$ gzip -dc embryophyta_3193_OrthoDB9_orthogroup_info.txt.gz |head -10 |cut -f 1-2

OrthoGroupID Description

EOG09360002 "Zinc finger, UBR-type"

EOG0936000A "Zinc finger, RING/FYVE/PHD-type"

EOG0936001N "PIK-related kinase"

EOG0936001W "Uncharacterized protein"

EOG09360025 "SNF2-related, N-terminal domain"

EOG0936003Z "P-loop containing nucleoside triphosphate hydrolases superfamily protein"

EOG0936004R "Telomere length regulation protein, conserved domain"

EOG0936004W "DNA-directed DNA polymerase, family B"

EOG0936008E "Zinc finger, RING/FYVE/PHD-type"

左端1、2列目にIDとdescriptionがある。植物のcore geneデータベースは1440遺伝子ある。この解凍してできたembryophyta_odb9/をランする時に指定する ("-l embryophyta_odb9")。


実行方法

Genome assembly

run_BUSCO.py -i scaffolds.fasta -o OUTPUT -l embryophyta_odb9 -m genome -c 8
  •  -i   Input sequence file in FASTA format. Can be an assembled
  • -o   output
  • -l  lineage,lineage Which BUSCO lineage to be used.(ここではembryophyta_odb9を指定)
  • -m      Specify which BUSCO analysis mode to run.
                            There are three valid modes:
                            - geno or genome, for genome assemblies (DNA)
                            - tran or transcriptome, for transcriptome assemblies (DNA)
                            - prot or proteins, for annotated gene sets (protein)
  • -c Number of threads/cores to use.


Transcriptome 

run_BUSCO.py -i transcripts.fasta -o OUTPUT -l embryophyta_odb9 -m transcriptome -c 8

アラビのRNAをde novoでアセンブルした配列(fasta)をクエリーとしている。

  • -l ここではembryophyta_odb9を指定

アラビのtranscriptomeデータをde novo assemblyして作った配列(54000 transcrpts)を解析したところ、10分くらいかかった。


full_table_OUTPUT~が詳細なデータとなる。またshort_summary_OUTPUT_PLANTに結果がまとめられている。summaryには以下のような情報が載っている。

#Summarized BUSCO benchmarking for file: transcripts.fasta 

#BUSCO was run in mode: trans

Summarized benchmarks in BUSCO notation

 : C:0%[D:0%],F:0%,M:0%,n:1440

 1357 Complete BUSCOs

 896 Complete and single-copy BUSCOs

 461 Complete and duplicated BUSCOs

 17 Fragmented BUSCOs

 66 Missing BUSCOs

 1440 Total BUSCO groups searched


植物用のcore geneのカタログは合計1440遺伝子あるが、1357見つかり、そのうち461はduplicateしているとの結果が出た。また、1440遺伝子のうち66が見つからないと出ている。

missing_buscos_list~には見つからなかった66のIDが載っている。orthoDBを検索して、どんな遺伝子がsingle copy orthologousとして見つからなかったか確認する。

Ortholog Search | cegg.unige.ch Computational Evolutionary Genomics Group


 今回の検証ではシロイヌナズナのリファレンスcDNAを使っている。ハウスキーピング遺伝子の発現がゼロになるとは考えにくいので、ナズナのゲノムにはmissingの66遺伝子の大半が存在しないということだろうか。


ラン途中にエラーが起きたら、fastaのヘッダーが悪さをしている可能性もあります。以下のようなコマンドでシンプルな名前に修正してランし直してみて下さい。

perl -ane 'if(/\>/){$a++;print ">name_$a\n"}else{print;}' input.fa > rename.fa


追記 1

version3

version3.02は少しコマンドが変更されている。

ここではdockerhubのイメージを使う(link)。

docker pull comics/busco

例えばバクテリアゲノムのアセンブル結果を評価

#ここでは中に入ってランする
docker run --rm -itv $PWD:/data/ comics/busco
cd /data/

run_BUSCO.py -i assembly.fasta -o busco -l bacteria_odb9/ -m genome -c 1


シロイヌナズナのRNA seq解析

2018 10/9 誤字修正 

2018 10/22 CyVerseチュートリアル追記 

2018 12/09 mapping追記

2018 12/12 前処理リンク追加

2019 10/21 リンク追加


植物のRNA seqを初めてされる方向けに作成した資料です。

真似すれば流れを再現できるように記載しています。興味があれば同じように実行してみてください。


論文

https://www.ncbi.nlm.nih.gov/pmc/articles/PMC3566969/


シーケンスデータ

https://www.ncbi.nlm.nih.gov/Traces/study/?acc=SRP010481


シロイヌナズナfastaファイルとgtfファイル

http://plants.ensembl.org/info/website/ftp/index.html


追記;コマンドにエラーがあったので修正。Rの流れも一部修正。(8/9)


追記

0、前処理には、こちらのツールが使えます。


1、index

bowtie2-build -f A_thaliana_TAIR10.fa chr


2、mapping

tophat2 -p 4 -I 50000 -i 20 -o tophat_WT1-1 -G Arabidopsis_thaliana.TAIR10.36.gtf chr WT_15flower_receptacles1-1/input.fastq
  • -p  num-threads  
  • -I  --max-intron-length (default: 500000)
  • -i  --min-intron-length  (default: 50)
  • -G --GTF
  • -o --output-dir (default: ./tophat_out)

以下はアライメントのsensitivityに影響するパラメータ。

  • --read-gap-length default: 2
  • --read-edit-dist default: 2
  • --read-mismatches default: 2
  • --read-realign-edit-dist default: "read-edit-dist" + 1
  • --min-anchor default: 8
  • --read-mismatches default: 2

ここではtophatでなくtophat2を使ってますが、HISAT2(紹介)への切り替えも考えて下さい。

 2021 追記

マッピングからリードカウントまでの流れはRSEMに切り替えることも検討してください。bowtie/bowtie2/star/hisat2のいずれかをアライナーとして使い、その後確率的リードカウントを行うパッケージです。出力は遺伝子レベルの発現行列ファイル、または転写産物レベルの発現行列ファイルになります。マッピングからリードカウントまでRSEMだけで一本化できます(アライナーのバイナリは必要)。マルチマッピングがない植物ゲノムはないと思うので、まず間違いなくカウント精度も上がるはずです(ランタイムは長くなります)。


3、rename

mv tophat_WT1-1/accepted_hits.bam tophat_WT1-1/WT1-1.bam


4、index

samtools index tophat_WT1-1/WT1-1.bam

step1-4を全てのサンプルに対して実行(またはスクリプトで処理)。


5、IGVでアライメントを確認

igv -g A_thaliana_TAIR10.fa 
Arabidopsis_thaliana.TAIR10.36.gtf,WT1-1/WT1-1.bam,WT1-2/WT1-2.bam,WT1-3/WT1-3.bam,MT1-1/MT1-1.bam,MT1-2/MT1-2.bam,MT1-3/MT1-3.bam


6、featurecountsでカウント。

featureCounts -T 8 -t exon -g gene_id -a Arabidopsis_thaliana.TAIR10.36.gtf \
-o counts.txt \
WT1-1/WT1-1.bam WT1-2/WT1-2.bam WT1-3/WT1-3.bam \
WT2-1/WT2-1.bam WT2-2/WT2-2.bam WT2-3/WT2-3.bam \
WT3-1/WT3-1.bam WT3-2/WT3-2.bam WT3-3/WT3-3.bam \
MT1-1/MT1-1.bam MT1-2/MT1-2.bam MT1-3/MT1-3.bam \
MT2-1/MT2-1.bam MT2-2/MT2-2.bam MT2-3/MT2-3.bam \
MT3-1/MT3-1.bam MT3-2/MT3-2.bam MT3-3/MT3-3.bam

cut -f 1,7-12 counts.txt > count_selected.txt #いらない情報を削る。

#先頭行も不要なら削る
sed -e '1d' count_selected.txt > count_filtered.txt

#今回は問題ないが、gene idに不要な文字があれば削る。"transcript:"を削るなら
sed -e "s/transcript://" count_selected.txt > count_filtered.txt


7、データの分析(R)

library("ggplot2") 
library("reshape2")
library("reshape")
 
rawCount = read.table("count_selected.txt", header = TRUE, row.names = 1)
head(rawCount) #必ず毎回確認
colnames(rawCount) <- c("WT1_1","WT1_2","WT1_3","WT2_1","WT2_2","WT2_3","WT3_1","WT3_2","WT3_3","MT1_1","MT1_2","MT1_3","MT2_1","MT2_2","MT2_3","MT3_1","MT3_2","MT3_3") #rename

head(rawCount) #必ず毎回確認
artificialCount = log2(rawCount + 1) 
head(artificialCount) #必ず毎回確認
ggplot(artificialCount, aes(x = WT1_1)) +
ylab(expression(log[2](count + 1))) +
geom_histogram(colour = "white", fill = "#525252", binwidth = 0.4)
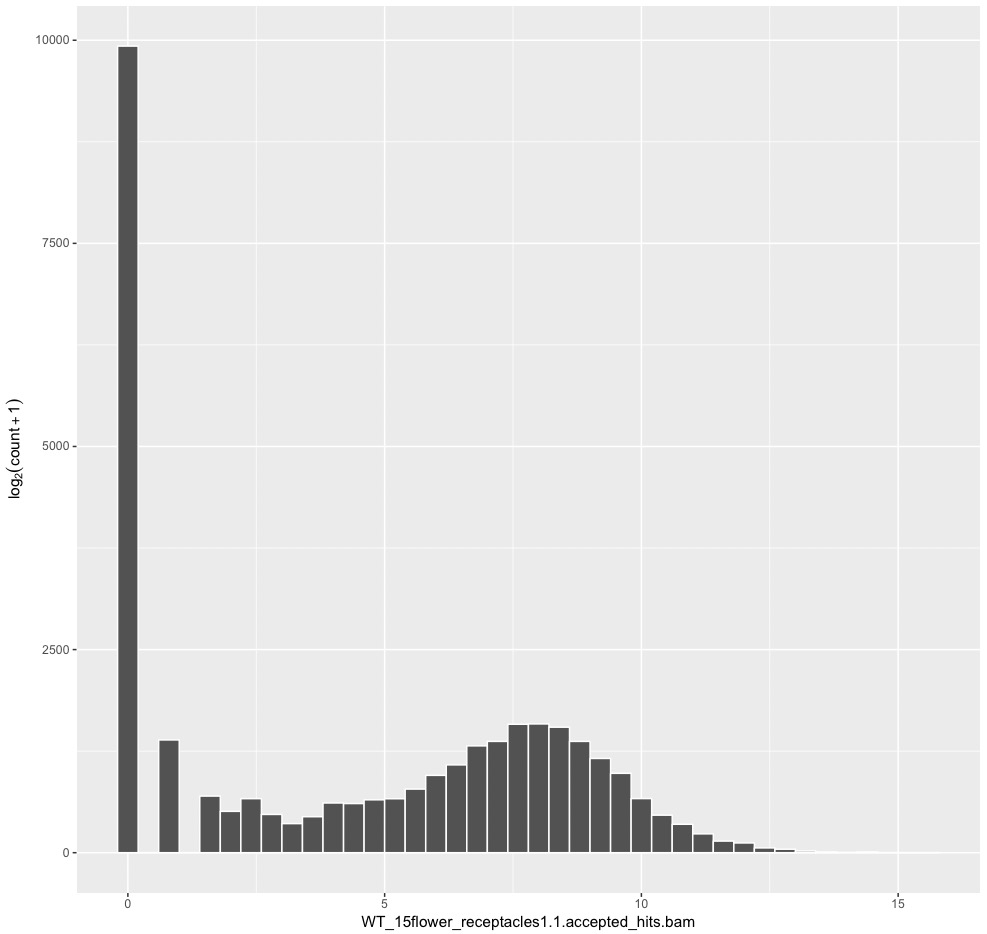
f:id:kazumaxneo:20170715153703j:plain

 #WT1_1のraw count dataのヒストグラム


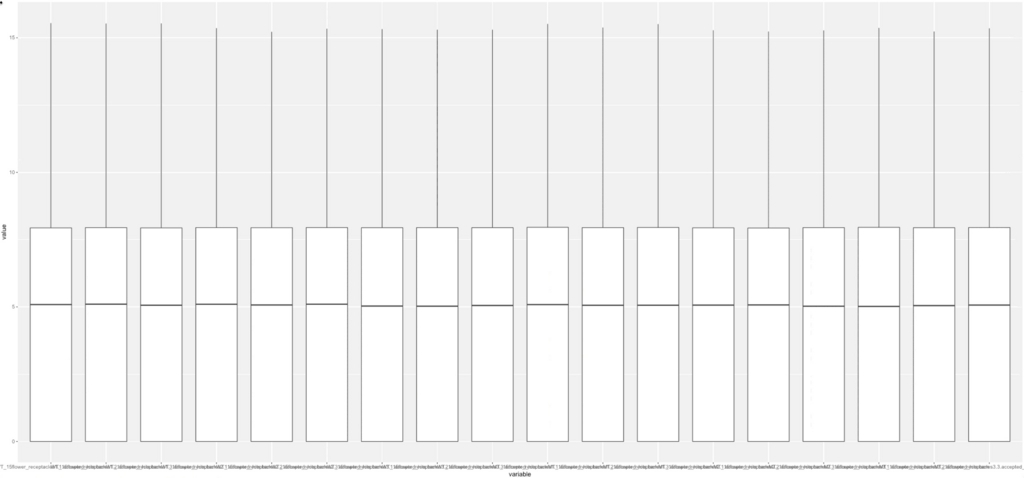
df <- melt(artificialCount) #data.frame形式に変換。 
head(df) #必ず毎回確認
g <- ggplot(df, aes (x = variable, y = value )) + geom_boxplot()
plot(g)

f:id:kazumaxneo:20170715154018j:plain

18サンプルのraw count dataのbox plot。  縦軸はlog2。


8、edgeRで正規化、DEG検出(R) 

次にedgeRでTMM正規化してbox plotを書く。

library("edgeR") 
count <- as.matrix(rawCount)
dim(count)
group <- factor(c("WT", "WT", "WT", "WT", "WT", "WT", "WT", "WT", "WT","MT", "MT", "MT", "MT", "MT", "MT", "MT", "MT", "MT"))
d <- DGEList(counts = count, group = group)
d <- calcNormFactors(d)  #全遺伝子commonの分散を計算
d <- estimateCommonDisp(d) #moderated tagwise dispersionの計算)
d <- estimateTagwiseDisp(d) #exact test
result <- exactTest(d) 
topTags(result)
table <- as.data.frame(topTags(result, n = nrow(count))) #toptagsで全行指定してデータフレームに変換
is.DEG <- as.logical(table$FDR < 0.05) #logical クラス(true、false)に判定付きで変換。
DEG.names <- rownames(table)[is.DEG] #trueだけDEG.namesに収納
plotSmear(result, de.tags = DEG.names, cex=0.3)

 FDR < 0.05

f:id:kazumaxneo:20170715154708j:plain


FDR < 0.01

f:id:kazumaxneo:20170715154833j:plain

 正規化係数とライブラリサイズの確認

正規化係数

> d$samples$norm.factors

 [1] 0.9888439 0.9993429 0.9877061 0.9953806 1.0011457 0.9931222 0.9891827

 [8] 0.9974448 0.9891228 0.9994781 1.0106604 1.0006687 1.0045275 1.0151970

[15] 0.9991256 1.0073002 1.0186367 1.0037970

ライブラリサイズ

> d$samples$lib.size

 [1]  8621707  6139876 10119340 10551274  7571024 12623646  8430112  5948333

 [9]  9897606  8022571  5732382  9460971  6524094  4626588  7563974  9157905

[17]  6514360 10694322


 TMM正規化。

calidata <- rawCount
head(calidata) #確認

calidata <- transform(calidata, WT1_1=(rawCount$WT1_1 / (d$samples$norm.factors[1] * d$samples$lib.size[1]) * 10^6)) #WT1_1 TMM calibration
calidata <- transform(calidata, WT1_2=(rawCount$WT1_2 / (d$samples$norm.factors[2] * d$samples$lib.size[2]) * 10^6)) #WT1_2 TMM calibration
calidata <- transform(calidata, WT1_3=(rawCount$WT1_3 / (d$samples$norm.factors[3] * d$samples$lib.size[3]) * 10^6)) #WT1_3 TMM calibration
.
. #continue to MT3-3 省略しますが18サンプル全部に実行。
.
calidata <- transform(calidata, MT1_3=(rawCount$MT1_3 / (d$samples$norm.factors[6] * d$samples$lib.size[6]) * 10^6)) #MT3_3 TMM calibration


#rename
colnames(calidata) <- c("WT1_1cali","WT1_2cali","WT1_3cali","WT2_1cali","WT2_2cali","WT2_3cali","WT3_1cali","WT3_2cali","WT3_3cali","MT1_1cali","MT1_2cali","MT1-3cali","MT2_1cali","MT2_2cali","MT2-3cali","MT3_1cali","MT3_2cali","MT3-3cali") 

head(calidata) #確認


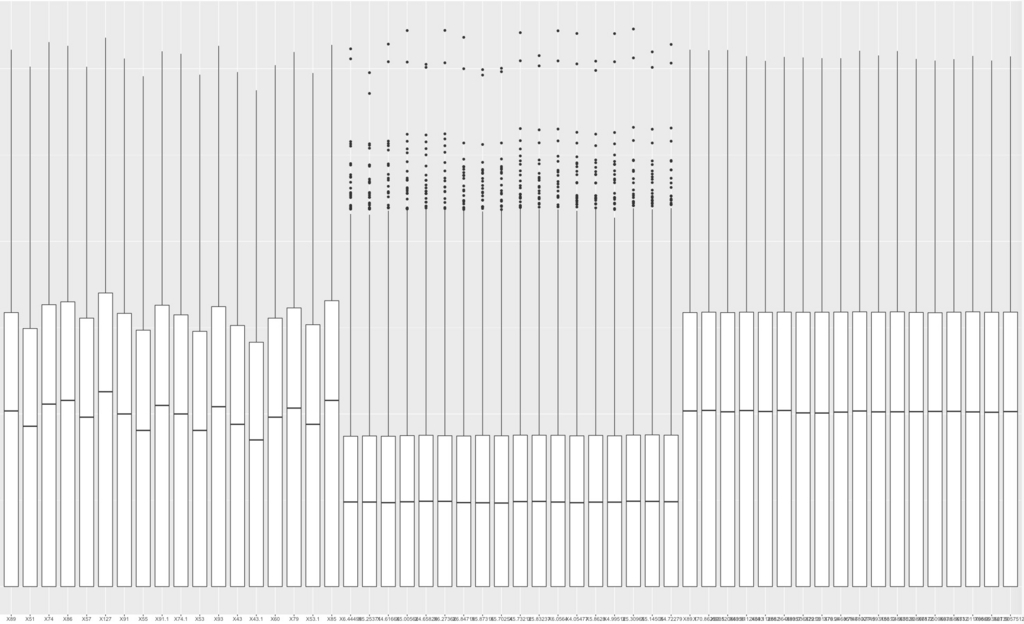
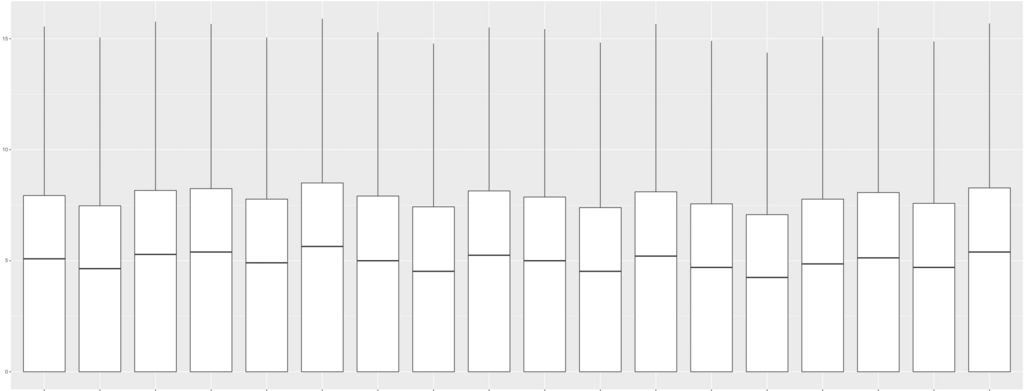
改めてbox plotを描画。

artificialCount = log2(calidata + 1)
head(artificialCount) #毎回確認
df <- melt(artificialCount) #data.frame形式に変換。
head(df) #必ず毎回確認
g <- ggplot(df, aes (x = variable, y = value )) + geom_boxplot()
plot(g)
f:id:kazumaxneo:20170715182417j:plain

TMM補正するとboxの高さがほぼ揃った。 縦軸はlog2。


参考

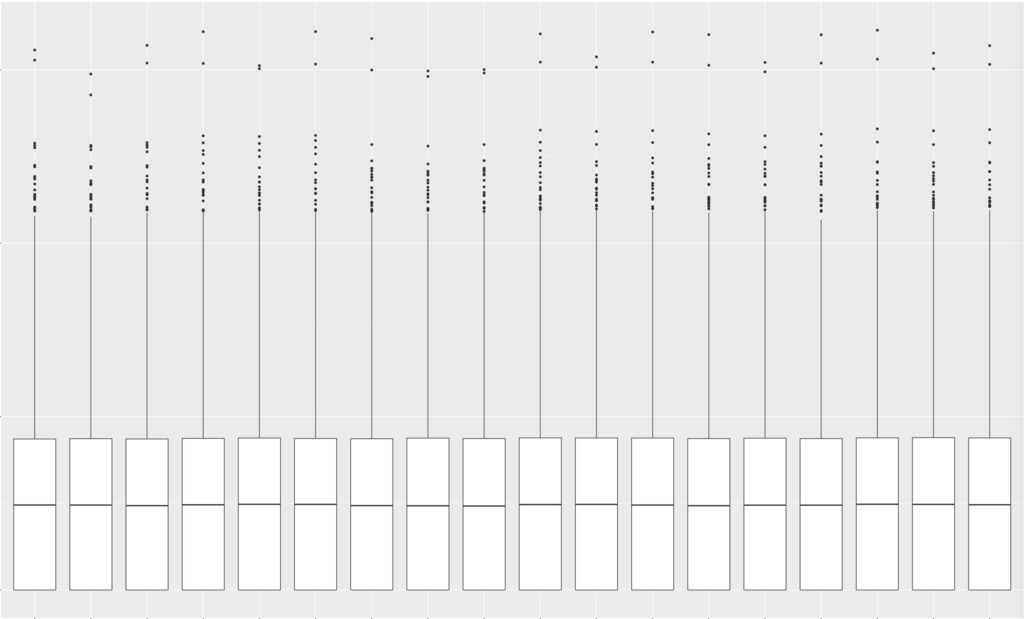
FPKM補正
f:id:kazumaxneo:20170716102942j:plain


参考。 左からraw count、FPKM、TMM。

f:id:kazumaxneo:20170716103527j:plain


 散布図 #参考サイト

plot(artificialCount[]) #全散布図 log2データ

f:id:kazumaxneo:20170802220205j:plain

小さすぎるので1/3だけキャプチャして載せています。


plot(artificialCount[,1],artificialCount[,9]) #WT1-1とMT1-1の散布図 log2データ

f:id:kazumaxneo:20170802220825j:plain

WT1_1とMT1_1の比較。


9、DEGの保存。(R)

edgeRのtableをresult.txtとして保存する(全遺伝子)。またFDRが0.01以下の遺伝子をsignificant.txtとして保存する。さらにsignificantのうち log Fold changeが0以上のtranscripts(fold change >1:誘導)と、 log Fold changeが0以下のtranscripts(fold change <1: 抑制)を取り出し保存する。

write.table(table, file = "result.txt", col.names = T, row.names = T, sep = " ", quote = F) #データを出力する。

#FDR<=0.01だけ取り出す
FDRThreshold <- table$FDR <= 0.01
significant <- table[FDRThreshold,]
head(significant) #確認
write.table(significant, file = "significant.txt", col.names = T, row.names = T, sep = ",", quote = F) #FDR<=0.01を保存

#誘導遺伝子を抽出
induction <- significant[(significant$logFC >= 0),] #誘導
head(induction) #確認
write.table(induction, file = "induction.txt", col.names = T, row.names = T, sep=",", quote = F) #保存

#抑制遺伝子を抽出
repression <- significant[(significant$logFC < 0),] #抑制
head(repression) #確認
write.table(repression, file = "repression.txt", col.names = T, row.names = T, sep = ",", quote = F) #保存


#Note 

 Modify the first row of induction.txt and repression.txt as shown below.

"logFC","logCPM","PValue","FDR"

  ↓ 

"name","logFC","logCPM","PValue","FDR" 


#注意

induction.txtrepression.txtを開いて、1行目にnameをつけ保存。

"logFC","logCPM","PValue","FDR"

  ↓ 

"name","logFC","logCPM","PValue","FDR" 


10、クラスタリング(R) 

クラスタリング

count <- as.matrix(calidata)
rho <- cor(count, method = "spearman")
d <- dist(1 - rho)
h <- hclust(d, method = "ward.D2")
plot(h)

f:id:kazumaxneo:20170802183954j:plain


WTとMTで仕分けられた。また容器ごとに仕分けられている。


11、ヒートマップ(R) 

FDR < 0.01のtrranscripts (significant) を選抜し、heat-mapを描く。

data = read.table("result_FDR0.01.txt", header = TRUE, row.names = 1)
colnames(data) <- c("WT1_1","WT1_2","WT1_3","WT2_1","WT2_2","WT2_3","WT3_1","WT3_2","WT3_3","MT1_1","MT1_2","MT1_3","MT2_1","MT2_2","MT2_3","MT3_1","MT3_2","MT3_3")
#確認
head(data, n = 3)

> head(data, n = 3) #出力を載せておく。

          WT1_1     WT1_2     WT1_3     WT2_1     WT2_2     WT2_3     WT3_1

AT1G01070   238  176.4618  257.6013  224.8571  212.5842  238.6935  233.1020

AT1G01080   421  426.5650  431.6101  362.8561  411.6709  399.8626  397.7047

AT1G01100  2438 2324.5710 2383.2383 2406.8644 2439.6563 2410.7365 2587.6366

              WT3_2     WT3_3    MT1_1     MT1_2     MT1_3     MT2_1     MT2_2

AT1G01070  219.8509  243.8365  271.128  266.3540  299.8743  265.3806  246.8589

AT1G01080  379.3506  419.7471  340.239  338.4609  353.0051  357.7434  323.0947

AT1G01100 2362.3197 2598.6001 2205.174 2051.3672 2270.2193 2258.3366 2116.4519

              MT2_3     MT3_1     MT3_2     MT3_3

AT1G01070  258.3369  241.2162  268.5197  242.2265

AT1G01080  337.3045  395.5576  396.9981  373.2671

AT1G01100 2229.1425 2294.7885 2128.8861 2354.7594


heatmap(as.matrix(data), margin=c(20,4), main="Heat Map 1 (Raw Data)")

f:id:kazumaxneo:20170803001457j:plain


library(genefilter) #リンク
data.z <- genescale(data, axis=1, method="Z")
heatmap(as.matrix(data.z), margin=c(20,4), main="Heat Map 2")

f:id:kazumaxneo:20170803002409j:plain


library(gplots) #リンク
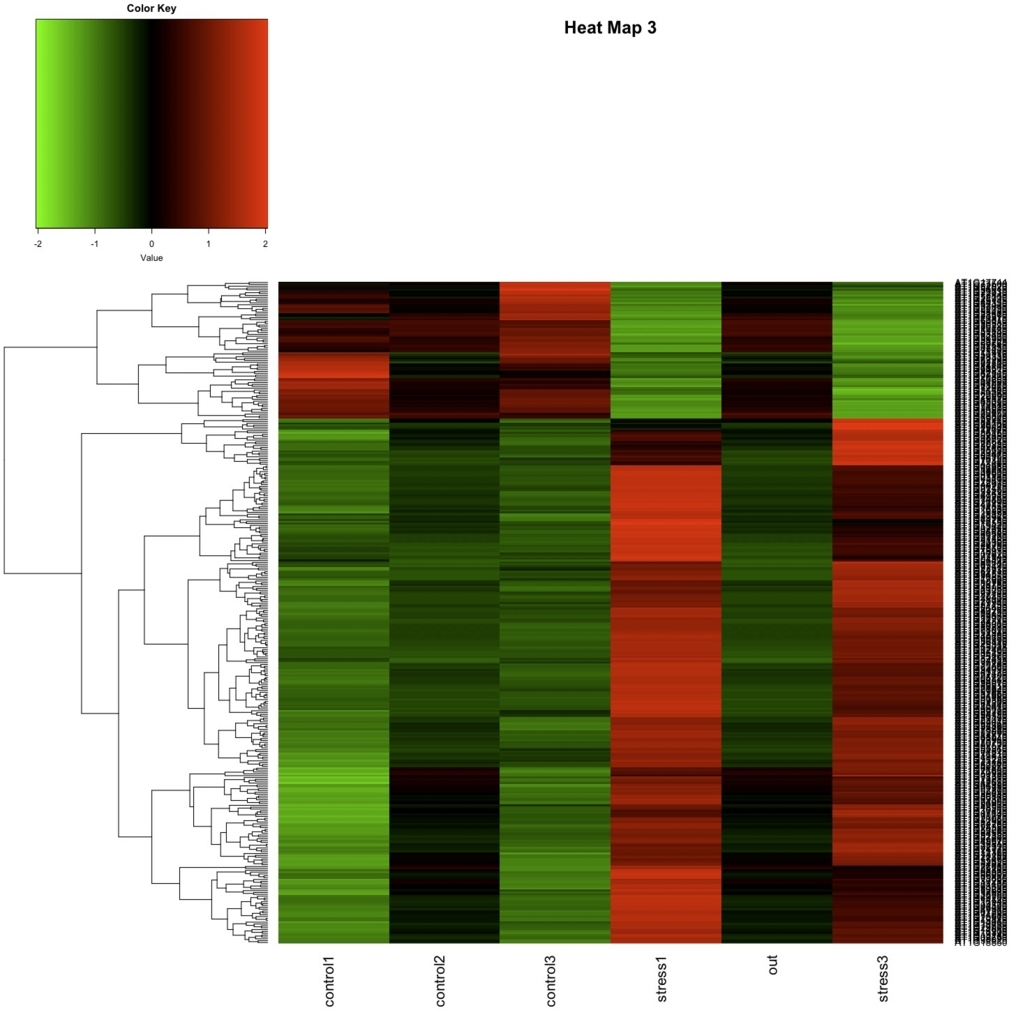
heatmap.2(as.matrix(data.z), col=greenred(75), scale="none", key=TRUE, symkey=FALSE, density.info="none", trace="none", cexRow=1, margin=c(6,8), main="Heat Map 3", Colv=NA)

f:id:kazumaxneo:20170803002516j:plain


 12、 主成分分析(R)

count <- as.matrix(count) 
count.log <- log10(count + 1)
count.log.var <- apply(count.log, 1, var)
count.log.pca <- count.log[order(count.log.var, decreasing = TRUE), ][1:200, ]
res <- prcomp(count.log.pca)
col <- c("red", "red", "red", "red", "red", "red", "red", "red", "red", "blue", "blue", "blue", "blue", "blue", "blue", "blue", "blue", "blue")
time <- c("1", "1", "1", "2", "2", "2", "3", "3", "3", "1", "1", "1", "2", "2", "2", "3", "3", "3")
pc1 <- res$rotation[, 1]
pc2 <- res$rotation[, 2]
pc3 <- res$rotation[, 3]
plot(pc1, pc2, type = "n", asp = TRUE)
text(pc1, pc2, labels = time, col = col)
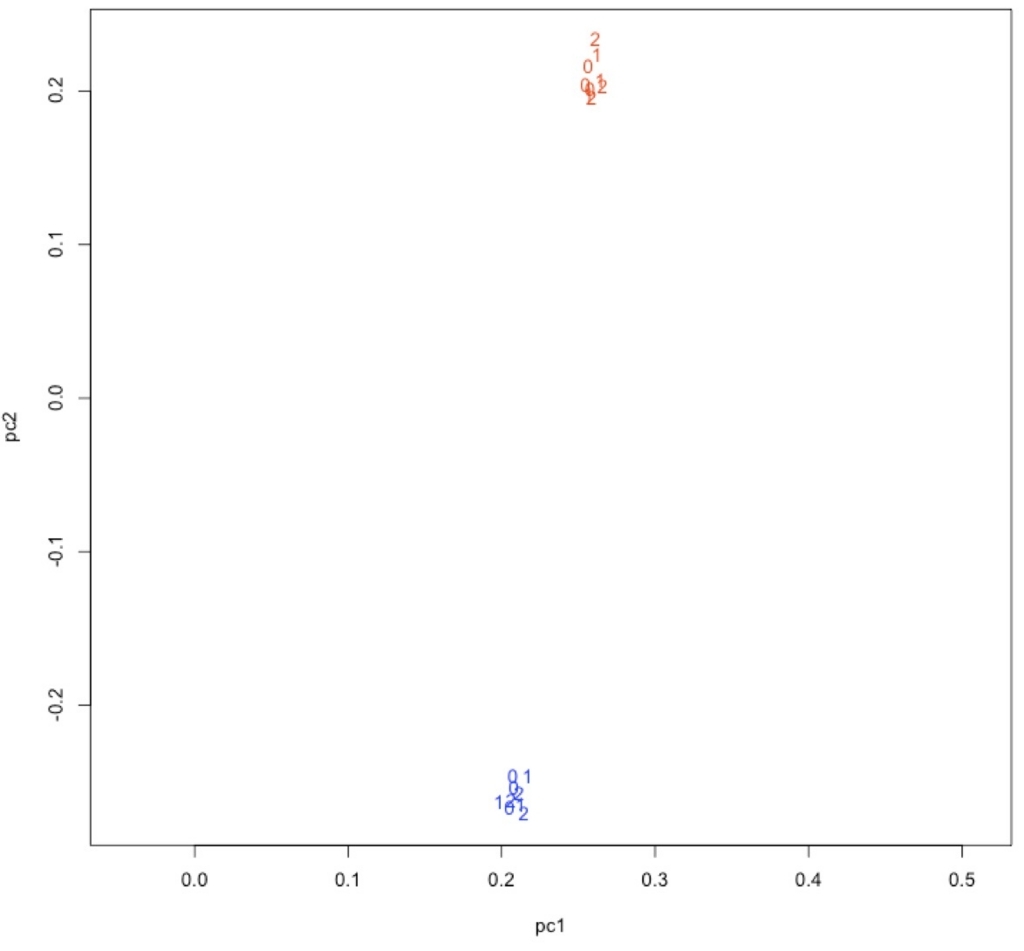
f:id:kazumaxneo:20170715220318j:plain

青がWT、赤がMT。

plot(pc2, pc3, type = "n", asp = TRUE) 
text(pc2, pc3, labels = time, col = col)
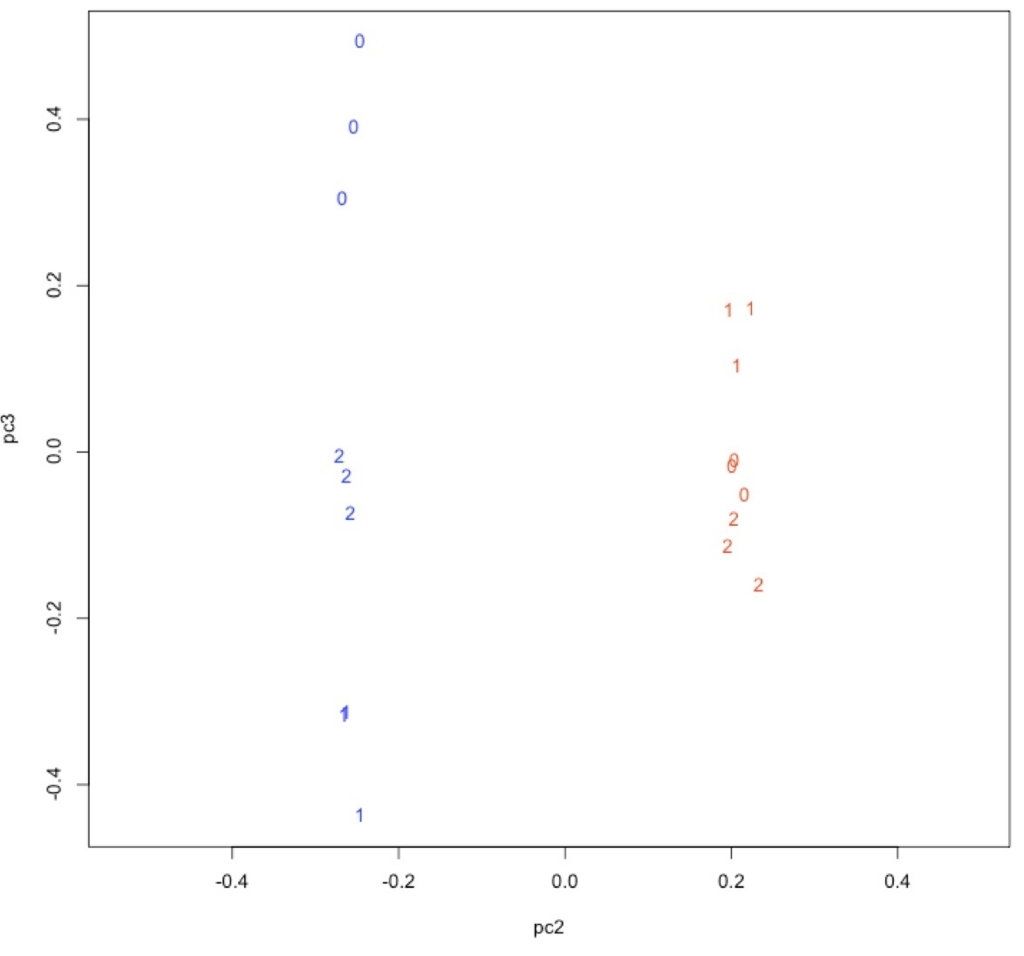
f:id:kazumaxneo:20170715220344j:plain


induction.txt、repression.txt、significant.txtの1行目を"logFC","logCPM","PValue","FDR" から "name","logFC","logCPM","PValue","FDR"に変更。


 13、GOエンリッチメント解析

library(org.At.tair.db) #リンク
library(goProfiles) #リンク

x <- read.csv("induction.txt", header=TRUE, sep=",")#上の方でlogFC>=0条件で抽出したデータを読み込む。
head(x, n=3)
# name logFC logCPM PValue FDR
# 1 AT5G03820 3.811659 6.257744 0.00e+00 0.00e+00
# 2 AT2G02010 3.590547 5.904101 0.00e+00 0.00e+00
# 3 AT1G71380 2.365841 5.759736 0.00e+00 0.00e+00


induction <- basicProfile(genelist=x$name, onto='ANY', level=2, orgPackage="org.At.tair.db") #x$nameが遺伝子リスト

 basicProfileリンク)。

  • genelist List of genes on which the Profile has to be based
  • onto Ontology on which the profile has to be built( ANY, ’MF’,’BP’,’CC’).
  • Level Level of the ontology at which the profile has to be built
  • orgPackage Name of a Bioconductor's organism annotations package ('org.Xx-eg-db').


plotProfiles(induction) #plotProfilesリンク

 出力が以下になる。

f:id:kazumaxneo:20170802184422j:plain

ANYだと一部のカテゴリが削られている。 ’MF’,’BP’,’CC’に分けた方が良い。下はANYと同じパラメータで ’MF’,’BP’,’CC’を指定してグラフを書いている。
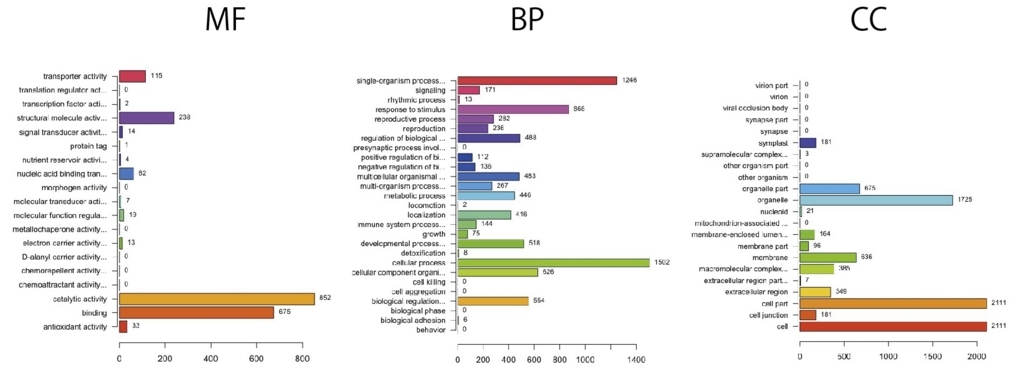
f:id:kazumaxneo:20170718175228j:plain


 抑制

y <- read.csv("repression.txt", header=TRUE)#上の方でlogFC<0条件で抽出したデータを読み込む。
head(y, n=3)
# name logFC logCPM PValue FDR
# 1 AT1G75945 -7.543735 2.836073 1.53e-272 8.35e-269
# 2 AT3G23460 -1.906906 4.256721 4.08e-145 8.37e-142
# 3 AT4G05715 -5.862613 2.371176 2.38e-97 2.37e-94

repression <- basicProfile(genelist=y$name, onto='MF', level=2, orgPackage="org.At.tair.db")
plotProfiles(repression)
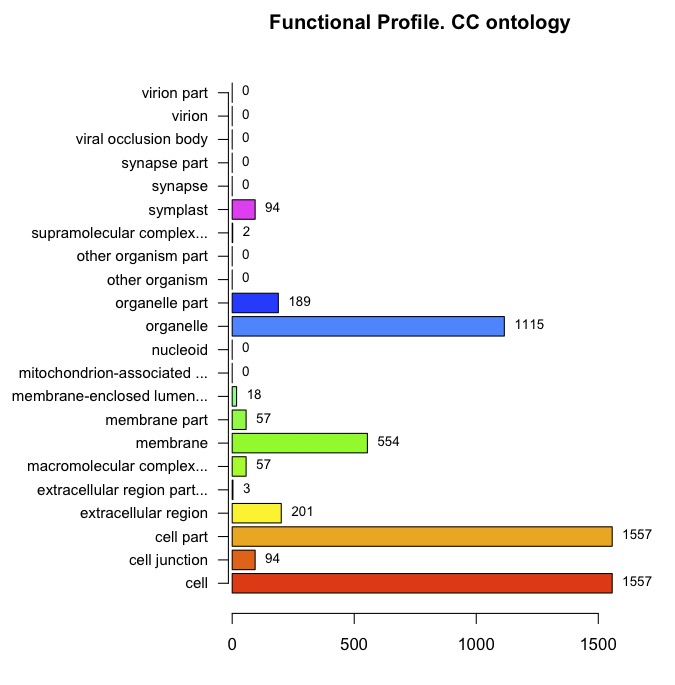
f:id:kazumaxneo:20170718174618j:plain

 誘導、抑制を同時に書く。MFを書いてみる。

induction <- basicProfile(genelist=x$name, onto='MF', level=2, orgPackage="org.At.tair.db") #MF、level2
repression <- basicProfile(genelist=y$name, onto='MF', level=2, orgPackage="org.At.tair.db") #MF、level2

result <- mergeProfilesLists(induction, repression, profNames = c("induction", "repression"))
plotProfiles(result, legendText = c("induction", "repression"), percentage = TRUE)

f:id:kazumaxneo:20170802184448j:plain


保存  

write.table(result, file = "GO_profile.txt")

テキストファイルが保存される。

MF.Description "MF.GOID" "MF.induction" "MF.repression"
13 "antioxidant activity" "GO:0016209" 33 12
9 "binding" "GO:0005488" 674 492
4 "catalytic activity" "GO:0003824" 852 609
1 "electron carrier activity" "GO:0009055" 13 4
14 "metallochaperone activity" "GO:0016530" 0 1
20 "molecular function regulator" "GO:0098772" 18 18
19 "molecular transducer activity" "GO:0060089" 7 18
3 "nucleic acid binding transcription factor activity" "GO:0001071" 62 96
6 "nutrient reservoir activity" "GO:0045735" 4 5
10 "protein tag" "GO:0031386" 1 0
5 "signal transducer activity" "GO:0004871" 14 25
7 "structural molecule activity" "GO:0005198" 238 10
2 "transcription factor activity, protein binding" "GO:0000988" 2 0
8 "transporter activity" "GO:0005215" 115 171

数が多い少ないでは意味が薄い。割合を出し検定を行い、エンリッチメントされた可能性がある系を絞り込む必要がある。


pathway

#先ほど読み込んだx(誘導された遺伝子を示したdata.frame)を使う。
library(pathview) #(pathviewインストール情報リンク

path.id <- "00010" #解糖系
path <- pathview(gene.data = as.matrix(x$name), pathway.id = path.id, species = "ath", gene.idtype = "KEGG")
  • gene.data either vector (single sample) or a matrix-like data (multiple sample).
  • pathway.id character vector, the KEGG pathway ID(s), usually 5 digit, may also include the 3 letter KEGG species code. 
  • species character, either the kegg code, scientific name or the common name of the tar- get species.
  • gene.idtype character, ID type used for the gene.data, case insensitive. Default gene.idtype="entrez", i.e. Entrez Gene, which are the primary KEGG gene ID for many common model organisms. For other species, gene.idtype should be set to "KEGG" as KEGG use other types of gene IDs.

 pathwayのpngがワーキングディレクトリに保存される。
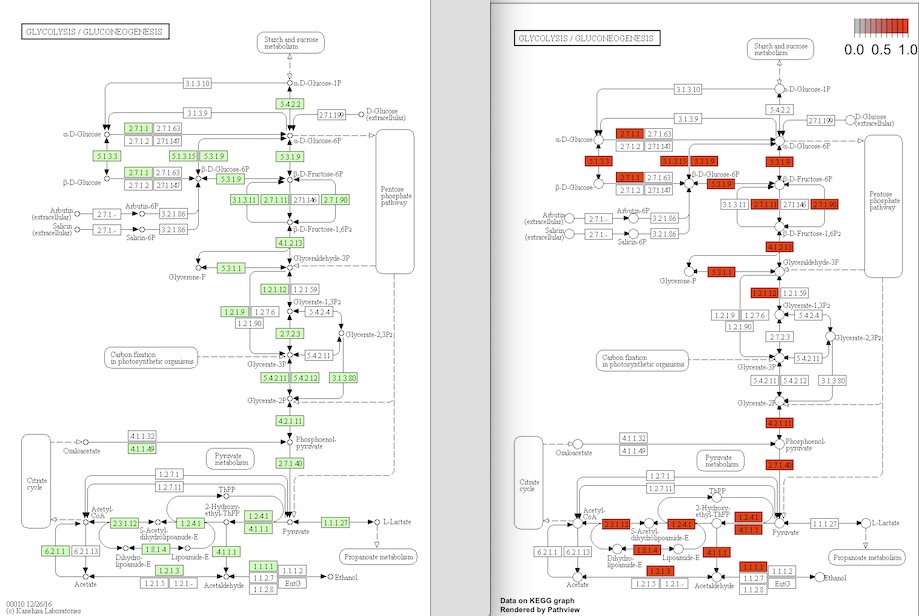
f:id:kazumaxneo:20170718123936j:plain

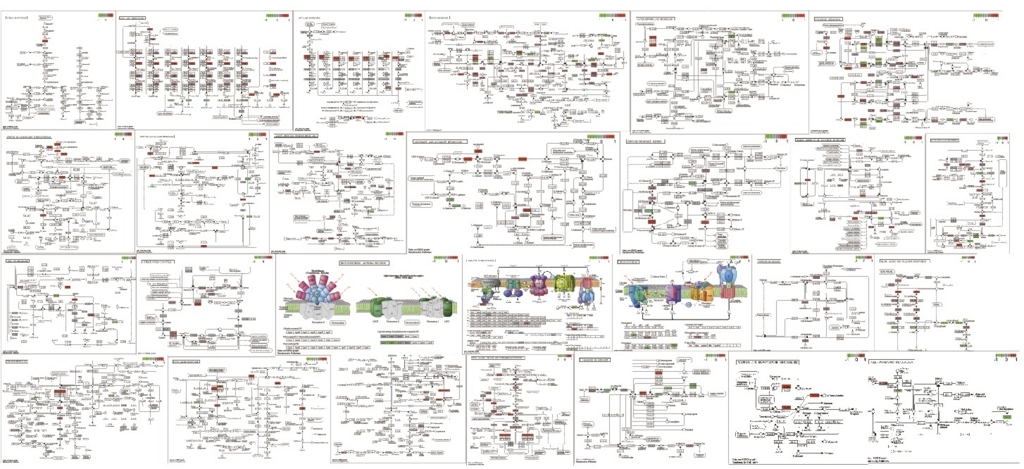
解糖系のpathway。左はアラビでアノテーションされている遺伝子(緑)の図。右が誘導されていた遺伝子(赤)の図。


最初は全てのpathwayを見た方が良いかもしれない。しかし全部調べるのは面倒臭い。それならpathwayのIDを一括取得して、ループで回した方が便利なので、pathwayのIDを取得して全pathwayを描画する流れを書いておく。


1、Rを中断(crt + z)、または新しいターミナルのタブを開く。

2、まずkeggに登録された生物名をこのリンクから確認する。Arabidopsis属だと2つ登録されている。

T00041 ath Arabidopsis thaliana (thale cress) Eukaryotes;Plants;Eudicots;Mustard family 
T01578 aly Arabidopsis lyrata (lyrate rockcress) Eukaryotes;Plants;Eudicots;Mustard family

2、A.thaliana とA.lyrataが見つかるが、ここではA.thalianaを使う。左端にathと略号が書かれていることに注目。これをURL(http://rest.kegg.jp/list/pathway/)につけて、http://rest.kegg.jp/list/pathway/ath と検索する。

3、A.thalianaのpathway一覧が表示されている。

f:id:kazumaxneo:20170802184626j:plain

#参考  ちなみにhttp://rest.kegg.jp/list/athだと遺伝子リスト。


4、このページ全体をコピペするか、wgetを叩きダウンロードする。wgetなら下のように打つ。

wget http://rest.kegg.jp/list/pathway/ath -O - |sed -e 's/path://g' > pathway_list

sedで先頭のpath:ath00010のpath:を消しながらダウンロードしている。

5、A.thalianaのkegg pathway IDのリストが入手できた。

user$ head -3  pathway_list

ath00010 Glycolysis / Gluconeogenesis - Arabidopsis thaliana (thale cress)

ath00020 Citrate cycle (TCA cycle) - Arabidopsis thaliana (thale cress)

ath00030 Pentose phosphate pathway - Arabidopsis thaliana (thale cress)


入手したIDリストを使い、全pathwayを描く。

cut -f 1 pathway_list > pathway_ID

ちなみにRの中からunixのコマンドを呼び出して実行するなら

system("cut -f 1 pathway_list > pathway_ID")

Rに戻る(一時停止させているならfg %job番号で再開)。

IDlist <- read.table("pathway_ID", header=FALSE) #pathway IDを読み込み

path <- pathview(gene.data = as.matrix(x$name), pathway.id = unlist(IDlist), species = "ath", gene.idtype = "KEGG")

IDがデータフレームのままだと認識してくれないので、unlist(IDlist)

でベクトルに変換している。使った全てのpathwayのグラフが描画される。アラビだと10分くらいかかる。
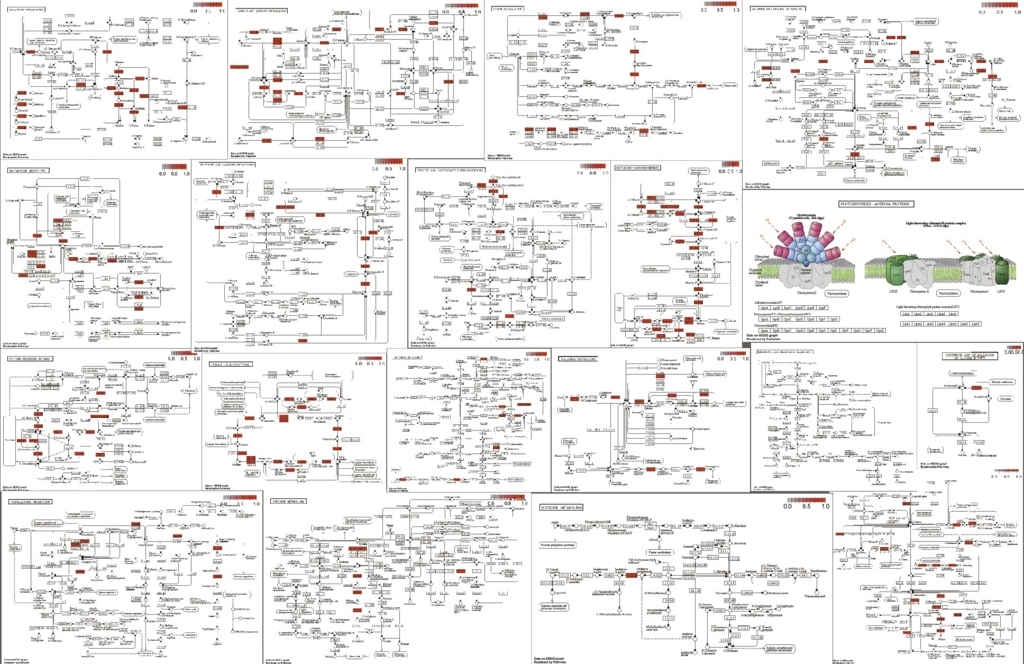
f:id:kazumaxneo:20170718144141j:plain

 全部は載せられないが、このように一括してpathwayを取得してマップを描画できる。もちろん、エンリッチされたpathwayがGO解析で分かっていれば、それだけ書いてもいい。


誘導、抑制をpathwayで表示できた方が便利そうなので、少し改良する。


significant.txtを開いて、1行目にnameをつけsignificant2.txtとして保存。

"logFC","logCPM","PValue","FDR"

  ↓ 

"name","logFC","logCPM","PValue","FDR" 


significant2.txtをRに読み込む。

significant <- read.table("significant2.txt", header=TRUE, sep=",")
head(significant, n=3) #確認
name logFC logCPM PValue FDR
1 AT5G03820 3.811659 6.257744 0.000000e+00 0.000000e+00
2 AT2G02010 3.590547 5.904101 0.000000e+00 0.000000e+00
3 AT1G71380 2.365841 5.759736 0.000000e+00 0.000000e+00

genelist <- as.vector(significant$logFC)
names(genelist) <- as.vector(significant$name)
path2 <- pathview(gene.data = genelist, pathway.id = unlist(IDlist), species = "ath", gene.idtype = "KEGG")

誘導、抑制が色でわかるようになった。

f:id:kazumaxneo:20170802184522j:plain

f:id:kazumaxneo:20170718152951j:plain

全部では無いが、その他の系。


resulttxtを開いて、1行目にnameをつけ保存。

"logFC","logCPM","PValue","FDR"

  ↓ 

"name","logFC","logCPM","PValue","FDR" 


library("clusterProfiler") #リンク
library(org.At.tair.db)
all = read.table("result.txt", header = TRUE) #全遺伝子(バックグラウンドとして使う)
head(all, n=3)
name logFC logCPM PValue FDR
1 AT5G03820 -3.967569 6.623068 0 0
2 AT2G02010 -3.770837 6.244671 0 0
3 AT4G23690 -2.719579 6.855122 0 0

allgene <- bitr(all$name, fromType="TAIR", toType="ENTREZID", OrgDb="org.At.tair.db") #比較できるようにIDをTAIRからENTREZIDに変換。
head(allgene)

x <- read.csv("induction.txt", header=TRUE)#上の方でlogFC>=0条件で抽出したデータを読み込む。
head(x)
y <- read.csv("repression.txt", header=TRUE)#上の方でlogFC<0条件で抽出したデータを読み込む。
head(y, n=3)

induction <- bitr(x$name, fromType="TAIR", toType="ENTREZID", OrgDb="org.At.tair.db") #コマンドbitrで誘導TAIR IDをENTREZIDへID変換する。
head(induction)
repression <- bitr(y$name, fromType="TAIR", toType="ENTREZID", OrgDb="org.At.tair.db") #コマンドbitrで抑制TAIR IDをENTREZIDへID変換する。
head(repression)

egoBP <- enrichGO(gene = induction[,2], 
 universe = allgene[,2], #allgeneと比較
 OrgDb = org.At.tair.db,
 ont = "BP",
 pAdjustMethod = "BH",
 pvalueCutoff = 0.01,
 qvalueCutoff = 0.05,
 readable = TRUE)

write.table(egoBP[,-8], "GO_BP_over-representation.txt", quote=F, col.names=TRUE, sep ="\t") #保存
#CC、MFについても同様に実行する。また抑制についても行う。

このようになった。

#誘導 最初の5行 (合計294)

  ID Description GeneRatio BgRatio pvalue p.adjust qvalue Count
GO:0001510 GO:0001510 RNA methylation 141/2099 172/20469 2.76E-109 4.17E-106 2.90E-106 141
GO:0042254 GO:0042254 ribosome biogenesis 179/2099 338/20469 1.51E-87 1.14E-84 7.91E-85 179
GO:0022613 GO:0022613 ribonucleoprotein complex biogenesis 179/2099 344/20469 7.14E-86 3.59E-83 2.50E-83 179
GO:0009451 GO:0009451 RNA modification 169/2099 325/20469 5.55E-81 2.09E-78 1.46E-78 169


 誘導された遺伝子についてGO絶対数のグラフと、全遺伝子に対して有意差検定したグラフの2つを描く。

ggoCC <- groupGO(gene = induction$ENTREZID, OrgDb = org.At.tair.db, ont = "CC", level = 3, readable = TRUE) #ほか2つも実行

barplot(ggoCC, drop=TRUE, showCategory=20, font=12) #検出されたGOの数のグラフ


f:id:kazumaxneo:20170802184545j:plain


#全IDと比較してp値を計算しバーの色で表現する(上で計算したegoBPを使う)

barplot(egoBP, showCategory=20, font=12)

f:id:kazumaxneo:20170725224023j:plain


dot plotでグラフ化することも可能。

dotplot(egoBP,showCategory=20, font=12)

f:id:kazumaxneo:20170725224518j:plain


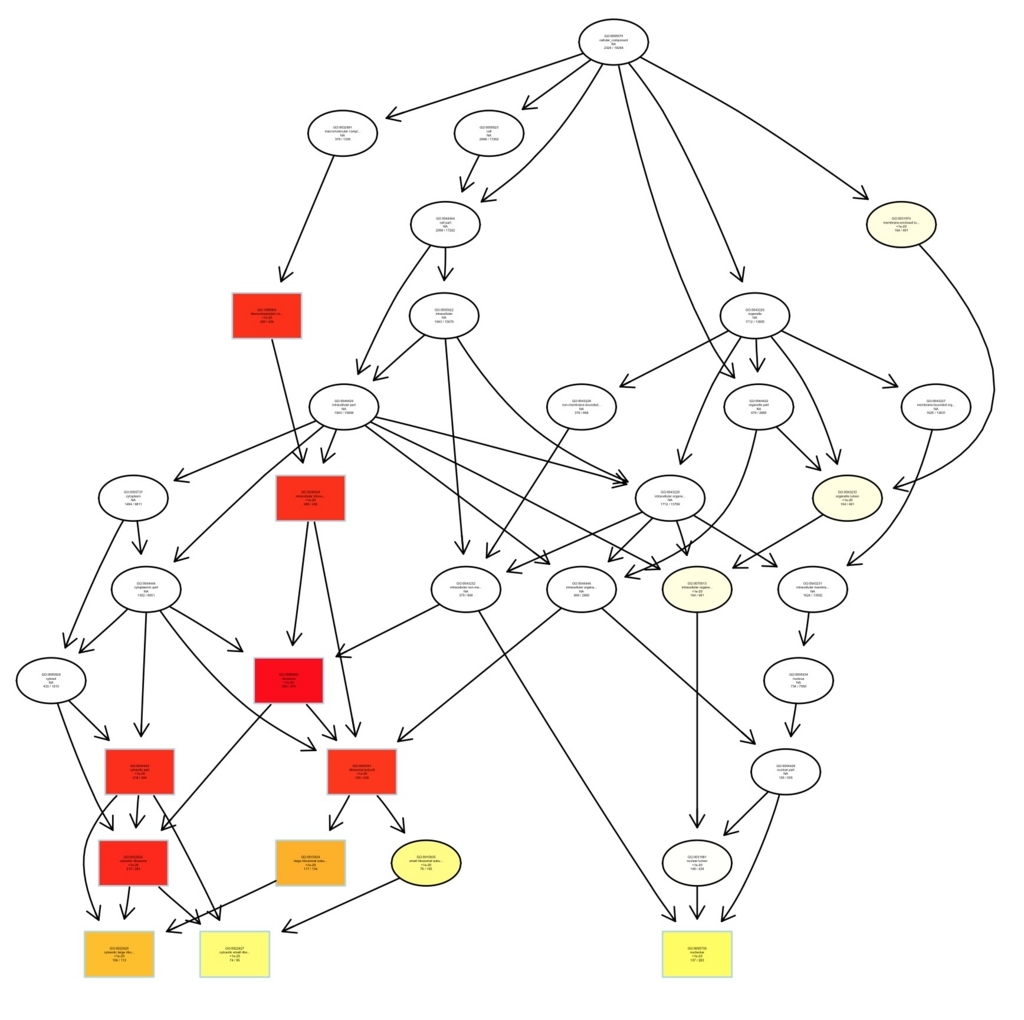
plotGOgraph(egoCC)

f:id:kazumaxneo:20170723004242j:plain


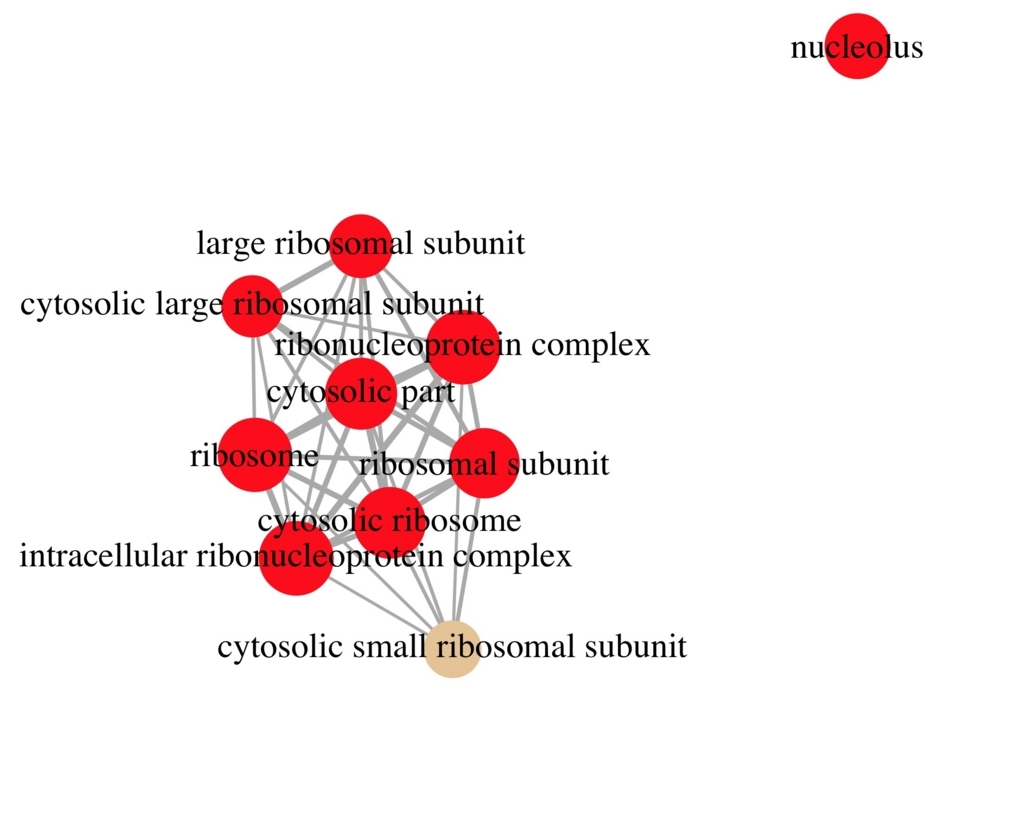
enrichMap(ego, n=10) 

f:id:kazumaxneo:20170723005837j:plain


 Bioconductor のpathway解析ツール(117種類)

Bioconductor - BiocViews


 Bioconductor のenrichment解析ツール(82種類)

Bioconductor - BiocViews


引用 

TMM正規化

http://www.nathalievilla.org/doc/pdf/tutorial-rnaseq.pdf


edgeR

二群間比較(edgeR) | RNA-Seq による比較トランスクリプトーム解析


クラスタリング

階層クラスタリング | スピアマンの順位相関係数を利用したクラスタリング


成分解析

主成分分析 | RNA-Seq リードデータをクラスタリング


GO profile

goProfiles | 遺伝子セットの GO term の出現頻度を調べ棒グラフで視覚化

org.At.tair.db | シロイヌナズナのアノテーション Bioconductor


pathview

pathview | KEGG パスウェイの視覚化パッケージ


ヒートマップ作成


どんな図を作成すべきかのナビゲート。


コマンドが難しければCyVerseを使うのも手です。

CYVERSE RNA seqチュートリアル

  • RNA-seq Tutorial- STAR, StringTie and DESeq2

https://pods.iplantcollaborative.org/wiki/display/TUT/RNA-seq+Tutorial-+STAR%2C+StringTie+and+DESeq2


  • RNA-Seq with Kallisto and Sleuth

https://cyverse-kallisto-tutorial.readthedocs-hosted.com/en/latest/


どれだけrepicatesやリード数は必要か?

ENCODEのガイドライン

https://www.encodeproject.org/about/experiment-guidelines/

=> RNA seq

ENCODE Experimental Guidelines for ENCODE3 RNA-seq
 

RNA seqのリードカウント featureCounts

2019 6/19 インストール追記

2019 6/19 追記

2019 8/14 help追加

2019 8/15 run log追加

2020 11/1 コマンド追加


RNA reqのリードカウントツールを紹介する。

featureCounts


ダウンロード

sourceforgeリンク

https://sourceforge.net/projects/subread/files/subread-1.5.2/


インストール

ソースコードをダウンロードして解凍し、/srcに移動。macでは以下のようにしてビルドする。

cd subread-1.4.6-source/src
make -f Makefile.MacOS

#bioconda (link)
conda install -c bioconda subread

linux公式マニュアル参照。 

featureCounts

$ featureCounts


Version 1.6.4


Usage: featureCounts [options] -a <annotation_file> -o <output_file> input_file1 [input_file2] ... 


## Mandatory arguments:


  -a <string>         Name of an annotation file. GTF/GFF format by default. See

                      -F option for more format information. Inbuilt annotations

                      (SAF format) is available in 'annotation' directory of the

                      package. Gzipped file is also accepted.


  -o <string>         Name of output file including read counts. A separate file

                      including summary statistics of counting results is also

                      included in the output ('<string>.summary'). Both files

                      are in tab delimited format.


  input_file1 [input_file2] ...   A list of SAM or BAM format files. They can be

                      either name or location sorted. If no files provided,

                      <stdin> input is expected. Location-sorted paired-end reads

                      are automatically sorted by read names.


## Optional arguments:

# Annotation


  -F <string>         Specify format of the provided annotation file. Acceptable

                      formats include 'GTF' (or compatible GFF format) and

                      'SAF'. 'GTF' by default.  For SAF format, please refer to

                      Users Guide.


  -t <string>         Specify feature type in GTF annotation. 'exon' by 

                      default. Features used for read counting will be 

                      extracted from annotation using the provided value.


  -g <string>         Specify attribute type in GTF annotation. 'gene_id' by 

                      default. Meta-features used for read counting will be 

                      extracted from annotation using the provided value.


  --extraAttributes   Extract extra attribute types from the provided GTF

                      annotation and include them in the counting output. These

                      attribute types will not be used to group features. If

                      more than one attribute type is provided they should be

                      separated by comma.


  -A <string>         Provide a chromosome name alias file to match chr names in

                      annotation with those in the reads. This should be a two-

                      column comma-delimited text file. Its first column should

                      include chr names in the annotation and its second column

                      should include chr names in the reads. Chr names are case

                      sensitive. No column header should be included in the

                      file.


# Level of summarization


  -f                  Perform read counting at feature level (eg. counting 

                      reads for exons rather than genes).


# Overlap between reads and features


  -O                  Assign reads to all their overlapping meta-features (or 

                      features if -f is specified).


  --minOverlap <int>  Minimum number of overlapping bases in a read that is

                      required for read assignment. 1 by default. Number of

                      overlapping bases is counted from both reads if paired

                      end. If a negative value is provided, then a gap of up

                      to specified size will be allowed between read and the

                      feature that the read is assigned to.


  --fracOverlap <float> Minimum fraction of overlapping bases in a read that is

                      required for read assignment. Value should be within range

                      [0,1]. 0 by default. Number of overlapping bases is

                      counted from both reads if paired end. Both this option

                      and '--minOverlap' option need to be satisfied for read

                      assignment.


  --fracOverlapFeature <float> Minimum fraction of overlapping bases in a

                      feature that is required for read assignment. Value

                      should be within range [0,1]. 0 by default.


  --largestOverlap    Assign reads to a meta-feature/feature that has the 

                      largest number of overlapping bases.


  --nonOverlap <int>  Maximum number of non-overlapping bases in a read (or a

                      read pair) that is allowed when being assigned to a

                      feature. No limit is set by default.


  --nonOverlapFeature <int> Maximum number of non-overlapping bases in a feature

                      that is allowed in read assignment. No limit is set by

                      default.


  --readExtension5 <int> Reads are extended upstream by <int> bases from their

                      5' end.


  --readExtension3 <int> Reads are extended upstream by <int> bases from their

                      3' end.


  --read2pos <5:3>    Reduce reads to their 5' most base or 3' most base. Read

                      counting is then performed based on the single base the 

                      read is reduced to.


# Multi-mapping reads


  -M                  Multi-mapping reads will also be counted. For a multi-

                      mapping read, all its reported alignments will be 

                      counted. The 'NH' tag in BAM/SAM input is used to detect 

                      multi-mapping reads.


# Fractional counting


  --fraction          Assign fractional counts to features. This option must

                      be used together with '-M' or '-O' or both. When '-M' is

                      specified, each reported alignment from a multi-mapping

                      read (identified via 'NH' tag) will carry a fractional

                      count of 1/x, instead of 1 (one), where x is the total

                      number of alignments reported for the same read. When '-O'

                      is specified, each overlapping feature will receive a

                      fractional count of 1/y, where y is the total number of

                      features overlapping with the read. When both '-M' and

                      '-O' are specified, each alignment will carry a fractional

                      count of 1/(x*y).


# Read filtering


  -Q <int>            The minimum mapping quality score a read must satisfy in

                      order to be counted. For paired-end reads, at least one

                      end should satisfy this criteria. 0 by default.


  --splitOnly         Count split alignments only (ie. alignments with CIGAR

                      string containing 'N'). An example of split alignments is

                      exon-spanning reads in RNA-seq data.


  --nonSplitOnly      If specified, only non-split alignments (CIGAR strings do

                      not contain letter 'N') will be counted. All the other

                      alignments will be ignored.


  --primary           Count primary alignments only. Primary alignments are 

                      identified using bit 0x100 in SAM/BAM FLAG field.


  --ignoreDup         Ignore duplicate reads in read counting. Duplicate reads 

                      are identified using bit Ox400 in BAM/SAM FLAG field. The 

                      whole read pair is ignored if one of the reads is a 

                      duplicate read for paired end data.


# Strandness


  -s <int or string>  Perform strand-specific read counting. A single integer

                      value (applied to all input files) or a string of comma-

                      separated values (applied to each corresponding input

                      file) should be provided. Possible values include:

                      0 (unstranded), 1 (stranded) and 2 (reversely stranded).

                      Default value is 0 (ie. unstranded read counting carried

                      out for all input files).


# Exon-exon junctions


  -J                  Count number of reads supporting each exon-exon junction.

                      Junctions were identified from those exon-spanning reads

                      in the input (containing 'N' in CIGAR string). Counting

                      results are saved to a file named '<output_file>.jcounts'


  -G <string>         Provide the name of a FASTA-format file that contains the

                      reference sequences used in read mapping that produced the

                      provided SAM/BAM files. This optional argument can be used

                      with '-J' option to improve read counting for junctions.


# Parameters specific to paired end reads


  -p                  If specified, fragments (or templates) will be counted

                      instead of reads. This option is only applicable for

                      paired-end reads.


  -B                  Only count read pairs that have both ends aligned.


  -P                  Check validity of paired-end distance when counting read 

                      pairs. Use -d and -D to set thresholds.


  -d <int>            Minimum fragment/template length, 50 by default.


  -D <int>            Maximum fragment/template length, 600 by default.


  -C                  Do not count read pairs that have their two ends mapping 

                      to different chromosomes or mapping to same chromosome 

                      but on different strands.


  --donotsort         Do not sort reads in BAM/SAM input. Note that reads from 

                      the same pair are required to be located next to each 

                      other in the input.


# Number of CPU threads


  -T <int>            Number of the threads. 1 by default.


# Read groups


  --byReadGroup       Assign reads by read group. "RG" tag is required to be

                      present in the input BAM/SAM files.


# Long reads


  -L                  Count long reads such as Nanopore and PacBio reads. Long

                      read counting can only run in one thread and only reads

                      (not read-pairs) can be counted. There is no limitation on

                      the number of 'M' operations allowed in a CIGAR string in

                      long read counting.


# Assignment results for each read


  -R <format>         Output detailed assignment results for each read or read-

                      pair. Results are saved to a file that is in one of the

                      following formats: CORE, SAM and BAM. See Users Guide for

                      more info about these formats.


  --Rpath <string>    Specify a directory to save the detailed assignment

                      results. If unspecified, the directory where counting

                      results are saved is used.


# Miscellaneous


  --tmpDir <string>   Directory under which intermediate files are saved (later

                      removed). By default, intermediate files will be saved to

                      the directory specified in '-o' argument.


  --maxMOp <int>      Maximum number of 'M' operations allowed in a CIGAR

                      string. 10 by default. Both 'X' and '=' are treated as 'M'

                      and adjacent 'M' operations are merged in the CIGAR

                      string.


  --verbose           Output verbose information for debugging, such as un-

                      matched chromosome/contig names.


  -v                  Output version of the program.


マニュアル

featureCounts - quick guide

WEHI Bioinformatics - featureCounts


実行方法

inputはsam/bamファイルと、リファレンスのカウントするfeatureの場所を記したgtfファイルか、よりシンプルなSAFというフォーマットである。タブ区切りの5フィールドの形式で、公式サイトに例がある。

GeneID	Chr	Start	End	Strand
497097	chr1	3204563	3207049	-
497097	chr1	3411783	3411982	-
497097	chr1	3660633	3661579	-


シングルエンドのデータをカウント。例えば3つのbamからカウントデータを取得する。

featureCounts -T 8 -t exon -g gene_id -a annotation.gtf -o counts.txt input1.bam input2.bam input3.bam
  • -T Number of the threads. 1 by default.
  • -t Specify the feature type. Only rows which have the matched matched feature type in the provided GTF annotation file will be included for read counting. `exon' by default.
  • -g  Specify the attribute type used to group features (eg. exons) into meta-features (eg. genes), when GTF annotation is provided. `gene_id' by default.
  • -a Give the name of the annotation file. The program assumes that the provided annotation file is in GTF format. Use -F option to specify other annotation formats.
  • -o Give the name of the output file.

6サンプルカウントした結果のキャプチャが以下となる。

f:id:kazumaxneo:20170710110348j:plain

先頭部分数十行を載せている。出力はタブ区切りのテキストファイルで、1行目はコメント行(#)である。2行目以下は以下のような並びになっている。

‘Geneid’, ‘Chr’, ‘Start’, ‘End’, ‘Strand’,‘Length’,‘sample1_count’,‘sample2_count’ ...

2列目に1;1;1;1;1;1とあるのは、exsonが6あることを意味している。lengthは1つの遺伝子のオーバーラップをのぞいたexonの合計サイズ (bp) である。右端にあるのがカウントの列である。サンプル数分だけできる。


strand specificにカウント。

featureCounts -s 1 -T 8 -t exon -g gene_id -a annotation.gtf -o counts.txt <input.bam>
  • -s  Indicate if strand-specific read counting should be performed. It has three possible values: 0 (unstranded), 1 (stranded) and 2 (reversely stranded). 0 by default.

"-s 1"はfeatrureと同じ向きにアライメントされたリードだけカウント。"-s 2"はfeatureの反対向きにアライメントされたリードだけカウント。


ペアリードのフラグメントをカウント。

featureCounts -p -T 8 -t exon -g gene_id -a annotation.gtf -o counts.txt <input_PE.bam>
  • -p If specified, fragments (or templates) will be counted instead of reads. This option is only applicable for paired-end reads. The two reads from the same fragment must be adjacent to each other in the provided SAM/BAM file.


複数ファイルを同時にカウントして出力する。

featureCounts -T 8 -t exon -g gene_id -a annotation.gtf -o counts.txt library1.bam library2.bam library3.bam

bam/samをスペース区切りで記載する。


ペアエンドの両方がマッピングされたものだけカウント。

featureCounts -p -B -t exon -g gene_id -a annotation.gtf -o counts.txt <input_PE.bam>
  • -B If specified, only fragments that have both ends successfully aligned will be considered for summarization. This option is only applicable for paired-end reads.


ペアエンドの両方がマッピングされたものだけカウント。unstranded。featureは CDS、rRNA、tmRNA、tRNAをカウント(フィーチャーは実際にannotation.gtfを開いて確認すること*1)。

featureCounts -p -B -s 0 -T 8 -t CDS,rRNA,tmRNA,tRNA -g transcript_id -a annotation.gtf -o counts.txt <input_PE.bam>

紹介したオプション以外に、インサートサイズに下限、上限を設けるオプション(-P-d, -Dや、異なるクロモソームにアライメントされたpaired-endを排除するオプション(-C)、マッピングクオリティの閾値-Q)、複数箇所にマッピングされたリードのカウント(-M)、など多様なオプションがあります。詳細は公式quickマニュアルを確認してください。


実行時は標準出力にlogも表示される。


        ==========     _____ _    _ ____  _____  ______          _____  

        =====         / ____| |  | |  _ \|  __ \|  ____|   /\   |  __ \ 

          =====      | (___ | |  | | |_) | |__) | |__     /  \  | |  | |

            ====      \___ \| |  | |  _ <|  _  /|  __|   / /\ \ | |  | |

              ====    ____) | |__| | |_) | | \ \| |____ / ____ \| |__| |

        ==========   |_____/ \____/|____/|_|  \_\______/_/    \_\_____/

  v1.6.4


//========================== featureCounts setting ===========================\\

||                                                                            ||

||             Input files : 6 BAM files                                      ||

||                           S SRX2391505.bam                                 ||

||                           S SRX2391506.bam                                 ||

||                           S SRX2391507.bam                                 ||

||                           S SRX2391512.bam                                 ||

||                           S SRX2391513.bam                                 ||

||                           S SRX2391514.bam                                 ||

||                                                                            ||

||             Output file : counts.txt                                       ||

||                 Summary : counts.txt.summary                               ||

||              Annotation : Escherichia_coli_k_12.ASM80076v1.44.gtf (GTF)    ||

||      Dir for temp files : ./                                               ||

||                                                                            ||

||                 Threads : 8                                                ||

||                   Level : meta-feature level                               ||

||              Paired-end : no                                               ||

||      Multimapping reads : not counted                                      ||

|| Multi-overlapping reads : not counted                                      ||

||   Min overlapping bases : 1                                                ||

||                                                                            ||

\\============================================================================//


//================================= Running ==================================\\

||                                                                            ||

|| Load annotation file Escherichia_coli_k_12.ASM80076v1.44.gtf ...           ||

||    Features : 4258                                                         ||

||    Meta-features : 4257                                                    ||

||    Chromosomes/contigs : 1                                                 ||

||                                                                            ||

|| Process BAM file SRX2391505.bam...                                         ||

||    Single-end reads are included.                                          ||

||    Assign alignments to features...                                        ||

||    Total alignments : 11635683                                             ||

||    Successfully assigned alignments : 8362707 (71.9%)                      ||

||    Running time : 0.03 minutes                                             ||

||                                                                            ||

|| Process BAM file SRX2391506.bam...                                         ||

||    Single-end reads are included.                                          ||

||    Assign alignments to features...                                        ||

||    Total alignments : 9923480                                              ||

||    Successfully assigned alignments : 7888505 (79.5%)                      ||

||    Running time : 0.02 minutes                                             ||

||                                                                            ||

|| Process BAM file SRX2391507.bam...                                         ||

||    Single-end reads are included.                                          ||

||    Assign alignments to features...                                        ||

||    Total alignments : 15194419                                             ||

||    Successfully assigned alignments : 12625859 (83.1%)                     ||

||    Running time : 0.04 minutes                                             ||

||                                                                            ||

|| Process BAM file SRX2391512.bam...                                         ||

||    Single-end reads are included.                                          ||

||    Assign alignments to features...                                        ||

||    Total alignments : 14376088                                             ||

||    Successfully assigned alignments : 11823380 (82.2%)                     ||

||    Running time : 0.03 minutes                                             ||

||                                                                            ||

|| Process BAM file SRX2391513.bam...                                         ||

||    Single-end reads are included.                                          ||

||    Assign alignments to features...                                        ||

||    Total alignments : 13734901                                             ||

||    Successfully assigned alignments : 11896845 (86.6%)                     ||

||    Running time : 0.03 minutes                                             ||

||                                                                            ||

|| Process BAM file SRX2391514.bam...                                         ||

||    Single-end reads are included.                                          ||

||    Assign alignments to features...                                        ||

||    Total alignments : 11465553                                             ||

||    Successfully assigned alignments : 9222513 (80.4%)                      ||

||    Running time : 0.03 minutes                                             ||

||                                                                            ||

||                                                                            ||

|| Summary of counting results can be found in file "counts.txt.summary"      ||

||                                                                            ||

\\============================================================================//


引用

featureCounts: an efficient general purpose program for assigning sequence reads to genomic features.

Liao Y, Smyth GK and Shi W (2014).  

Bioinformatics. 2014 Apr 1;30(7):923-30.


関連


オプションについてはbioinformaticsさんのページが詳しいです。


*1

featureCountsラン開始時にfeature数が画面に表示されるので、合っているか確認すること。

edgeR

2019 4/30 インストール方法修正

2022 1/23 追記


発現が負の二項分布に従うと仮定した検定法。正規化はTMMで行う。FPKM/RPKM補正のcufflinksより正しくDEGの検出ができる検定法とされる。詳細は門多先生のスライドやdry本の序章の正規化の話を読んでください。以下のマニュアルも大変参考になります。後半で正規化法について詳しく書かれています(英語です)。

http://chagall.med.cornell.edu/RNASEQcourse/Intro2RNAseq.pdf

こちらはTMM正規化の流れが丁寧に書かれています。

http://www.nathalievilla.org/doc/pdf/tutorial-rnaseq.pdf

 こちらはビギナー向けマニュアルです。FPKMは論文で使われれてても使うべからず、と説明されています。

http://chagall.med.cornell.edu/RNASEQcourse/Intro2RNAseq.pdf

edgeRのマニュアルが一番詳しい。ケーススタディも豊富。

https://bioconductor.org/packages/release/bioc/vignettes/edgeR/inst/doc/edgeRUsersGuide.pdf


インストール 

R  #Rに入る
#install
> if (!requireNamespace("BiocManager", quietly = TRUE))
install.packages("BiocManager")
BiocManager::install("edgeR")


 ここでは3反復で行われたstress条件とnormal条件の2群間比較のデータを検定してみる。データは前もってtophat2でアライメントして、featurecountsでカウントしてある。

3反復 2群比較のデータ(リンク

tophat2でmapping(リンク

featurecountsでカウント(リンク)。

正規化と検定(今ここ)


featurecountsの出力は以下のようなものである。先頭1行目はコメント行(#で始まる)で、2行目がheader行、3行目以降がデータとなっている。リードのカウント数を記載した列は7-12列である。

f:id:kazumaxneo:20170710110348j:plain

読み込む前に、edgeRでは不要な2-6列目を削る。

cut -f 1,7-12 all_featureCounts_strand_specific.txt > read_count.txt

長さ情報も捨てているが、edgeRは長さについて正規化をしないのでこれでよい。


Rの起動とedgeRの読み込み。

>R #R起動
library("edgeR")


リードデータの読み込み

count <- read.table("read_count.txt",sep = "	", header = T, row.names = 1) 

先頭のコメント行は無視され、2行目がヘッダーとなる。row.names=1で1 から始まる番号が行名として生成される。


行列データに変換。

count <- as.matrix(count)
dim(count) #行列の行と列数を確認


#normalを要素1-3、stressを要素4-6としたベクトルの識別ラベル、"group"を作成。

group <- factor(c("normal", "normal", "normal", "stress", "stress", "stress")) 


edgeRのDGEList(リンク)を使い、tableをオブジェクト化

d <- DGEList(counts = count, group = group) #DGEListオブジェクトを作成してdに格納


2022 1/23

任意で低発現遺伝子のフィルタリングを行う。上で定義したグループを考慮に入れる(クラシカルな2群間比較ではなく複雑な実験デザインの時はdesignを定義して、それを使う)

keep <- filterByExpr(d, group=group)
#低発現遺伝子をフィルタリング
d <- d[keep, , keep.lib.sizes=FALSE]

=> テストした時は3万遺伝子のうちの1万5千遺伝子ほどが除外された。


続いてedgeRのcalcNormFactorsリンク)を使い、TMM正規化の係数を計算

d <- calcNormFactors(d)    #TMM正規化

dの中身を確認。

d$samples

                                 group  lib.size   norm.factors

tophat_high_sensitivity_control1 normal 25628799    0.8480974

tophat_high_sensitivity_control2 normal 32962605    0.9635817

tophat_high_sensitivity_control3 normal 27119594    0.9932421

tophat_high_sensitivity_stress1  stress 25379772    1.0533018

tophat_high_sensitivity_stress2  stress 32962605    0.9635817

tophat_high_sensitivity_stress3  stress 18642271    1.2138616


 dの右端の列(norm.factors) の係数とlib.size(ライブラリーサイズ; トータルのリード数)の積を計算した値を使い補正される。

すなわち

ライブラリサイズ(トータルリード数)x 正規化係数

を計算した値で各サンプルを割ることになる。このように、edgeRはライブラリサイズと変動が少ないハウスキーピング遺伝子の発現量を使った正規化法である。


検定を行う。edgeRのマニュアル通り進める(リンク)。

d <- estimateCommonDisp(d)  #全遺伝子commonの分散を計算 (リンク
d <- estimateTagwiseDisp(d) #moderated tagwise dispersionの計算 (リンク
result <- exactTest(d)  #exact test(リンク


検定結果のtop10をedgeRのtopTagsコマンドで表示(リンク)。

topTags(result)

下のようになった。

> topTags(result)

Comparison of groups:  stress-normal 

              logFC   logCPM       PValue          FDR

AT1G09350 10.567190 6.101216 3.137694e-08 0.0002715988

AT1G77120  6.341318 8.882087 1.553797e-07 0.0006724831

AT1G04570  4.959992 5.609363 1.371816e-06 0.0039581457

AT1G01060  3.988584 5.278486 2.636780e-06 0.0057059928

AT1G20440  3.344557 8.131254 6.369575e-06 0.0110270090

AT1G09780  2.740267 8.804577 1.122465e-05 0.0132076639

AT1G16850  3.703996 8.951409 1.195946e-05 0.0132076639

AT1G62710  3.903980 6.677934 1.220671e-05 0.0132076639

AT1G20450  2.770247 5.902330 1.708683e-05 0.0156210368

AT1G18900  3.025852 5.706347 1.804648e-05 0.0156210368


解析結果を result.txt ファイルに保存。

table <- as.data.frame(topTags(result, n = nrow(count))) #toptagsで全行指定してデータフレームに変換
write.table(table, file = "result.txt", col.names = T, row.names = T, sep = " ", quote = F)

中身を確認。FDR<0.05を満たす遺伝子を確認する。

  logFC logCPM PValue FDR
AT1G09350 10.16307525 4.527258796 4.27E-09 0.000107078
AT4G14690 7.354181425 4.435418248 6.52E-09 0.000107078
AT3G22840 7.228134725 5.012923253 1.98E-08 0.000216609
AT4G12470 6.474020331 5.655042141 3.42E-08 0.000280991
AT3G55580 5.653555557 5.139781896 5.43E-08 0.000287357
AT5G52310 5.124986828 5.916626611 5.46E-08 0.000287357
AT4G21020 10.91063112 2.178134308 6.13E-08 0.000287357
AT1G77120 6.138518805 7.401568486 1.88E-07 0.000689566
AT3G09450 4.657253152 3.423533639 1.89E-07 0.000689566
AT1G01060 4.368122835 3.763121902 3.53E-07 0.00109118
AT2G07715 4.257034937 3.953448462 3.66E-07 0.00109118
AT1G04570 5.171798484 4.292665281 4.20E-07 0.001149004
AT4G33070 6.746791572 2.576092914 6.86E-07 0.001666543
AT5G17300 5.254208837 2.007723134 7.11E-07 0.001666543
AT5G37260 4.92542501 3.35910879 7.80E-07 0.001707349
AT4G02280 4.22594104 7.358454251 8.83E-07 0.00181116
ATCG00190 3.645754145 5.62775771 1.02E-06 0.001974423
AT5G59310 -5.174304818 2.241756997 1.16E-06 0.002122225
AT3G07050 3.431999493 4.513456519 1.41E-06 0.002430182
AT4G18690 9.538641966 0.830755067 1.73E-06 0.002838395
AT1G04560 5.293711871 3.142572477 2.18E-06 0.003398314
AT4G12480 5.657010399 2.190044061 2.28E-06 0.003398314
AT5G15960 6.905008258 6.46085288 2.47E-06 0.003532814
AT1G26790 6.025415721 0.792018063 2.71E-06 0.003703112
AT4G25433 5.27934755 1.508481739 2.89E-06 0.003703112
AT2G01008 3.91336062 3.369718716 2.99E-06 0.003703112
AT3G12860 3.56164772 2.72274909 3.05E-06 0.003703112
AT4G17090 4.057594021 8.295083362 4.03E-06 0.004719979
AT1G62710 3.833187835 5.158604303 4.80E-06 0.005432695
AT2G37770 3.401608114 3.427762539 5.05E-06 0.00552434
AT1G20440 3.238103764 6.394609506 5.31E-06 0.005624722
AT5G05270 2.944176517 6.213369092 6.00E-06 0.006156491
AT4G15430 2.995358995 3.898170281 6.20E-06 0.006168644
AT1G20450 2.899460216 3.89279605 7.87E-06 0.007179477
AT3G59670 2.900976613 4.387722673 8.10E-06 0.007179477
AT5G16930 3.00078392 4.028316392 8.27E-06 0.007179477
ATCG00180 3.045154042 3.083318107 8.28E-06 0.007179477
AT1G09780 2.784284171 6.845328834 8.31E-06 0.007179477
AT2G33210 2.89055242 4.722119045 8.71E-06 0.007262903
AT5G17030 3.074060891 4.463097295 9.06E-06 0.007262903
AT5G20830 2.957190377 5.8454128 9.07E-06 0.007262903
AT5G07990 3.307887967 3.536393301 9.56E-06 0.007470713
AT1G47510 2.816286516 3.981822721 1.01E-05 0.007663266
AT1G16850 3.623257952 7.724435616 1.03E-05 0.007663266
AT3G12270 2.775114741 4.098894865 1.08E-05 0.007791155
AT4G37910 3.026726294 5.176987655 1.09E-05 0.007791155
AT4G10120 2.688153454 4.612048946 1.21E-05 0.008353586
AT4G19975 6.19617109 0.664252933 1.22E-05 0.008353586
AT1G18900 2.744659249 3.962487564 1.28E-05 0.008546496
AT5G59320 -3.604847868 3.23617687 1.30E-05 0.008546496
AT2G23120 3.079019743 4.469576169 1.55E-05 0.009847484
AT3G03060 3.090251188 3.167877441 1.57E-05 0.009847484
AT1G06720 2.803080797 3.175083458 1.61E-05 0.009847484
AT5G15970 3.377579491 4.03069361 1.62E-05 0.009847484
AT4G25630 2.775891378 7.076363693 1.68E-05 0.010011705
AT2G05520 3.782813845 5.971256405 1.81E-05 0.010598322
AT2G40010 3.044930685 3.582251663 1.90E-05 0.010921949
AT1G29940 2.593259085 4.110832625 2.01E-05 0.011367248


遺伝子は合計32834行ある。そのうちP-value が0.01以下のtrasncriptsは1080で、さらにFDR<0.01を満たすのは54trasncriptsだけだった(FDRが太字の行)。


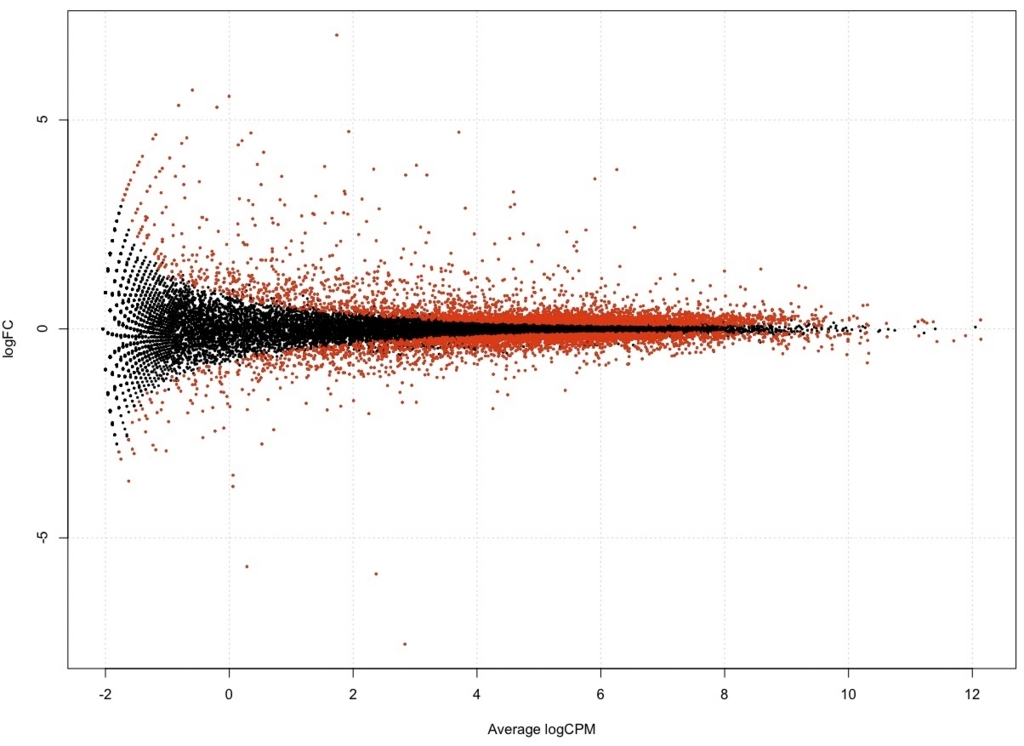
FDR < 0.05 の遺伝子を赤色でプロットする。

is.DEG <- as.logical(table$FDR < 0.05) #logical クラス(true、false)に判定付きで変換。
DEG.names <- rownames(table)[is.DEG] #trueだけDEG.namesに収納


edgeRのplotSmear(リンク)を使いM-A plotを描画する。

plotSmear(result, de.tags = DEG.names, cex=0.3)

plotSmearを使うとM-A  plotの図を容易に描画できる。オプションはリンク参照。 


FDR < 0.05

f:id:kazumaxneo:20170715122543j:plain

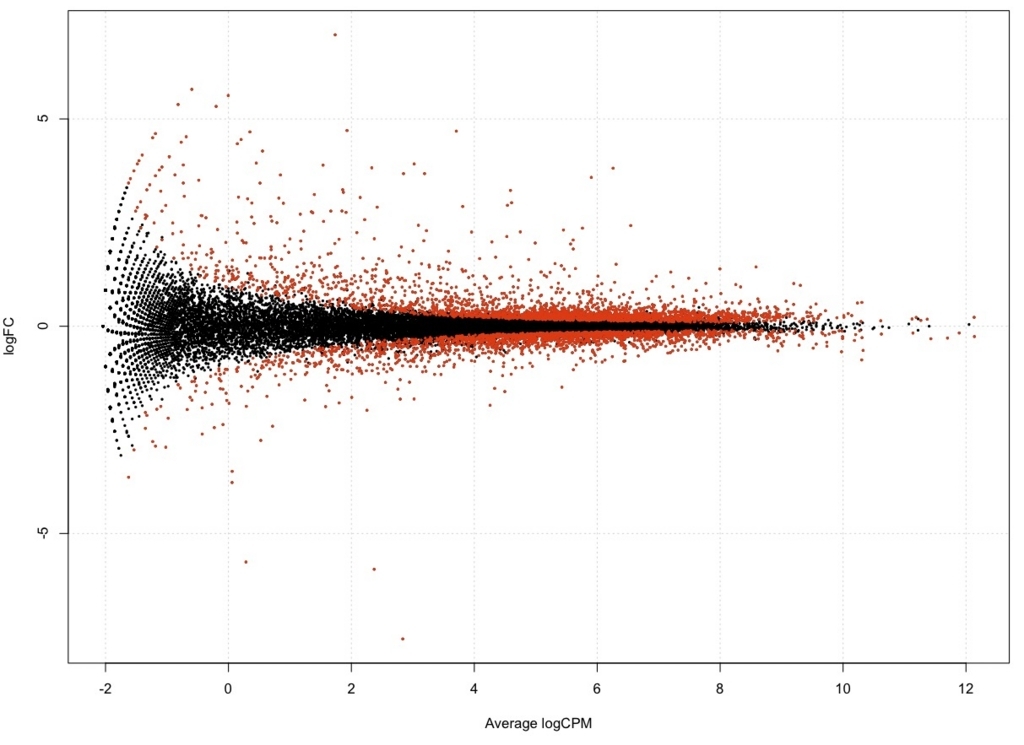
上が出力だが、DEGの数が妙に少ない。また以前にテストしたナズナ(Col)のデータとかなりplotの形が違う。下が以前のデータ。

FDR < 0.05

f:id:kazumaxneo:20170714080518j:plain

高発現の遺伝子ほどばらつきが少ないため、logFCが0に値が収束していくのだが、今回のデータはそうなっていない。ナズナのゲノムを使ってアライメントしているので、ランダムアライメントを多く拾ってしまっているのかもしれない。


DAVIDを使い、FDR<0.05の種類を調べてみる。

KEGG_PATHWAY でribosome合成系がhitした。Ribosome biogenesisのpathwayだった。

f:id:kazumaxneo:20170715123934j:plain

1つ開いてみる。

Ribosome

f:id:kazumaxneo:20170711132841j:plain

緑になっているのが、ナズナアノテーションが付いている遺伝子である。また、緑のobxの一部には赤色の星が付いてる。この星がDABIDの検索で見つかった今回DEGと判定された遺伝子になる。


Functional Annotation Chartも確認する。

f:id:kazumaxneo:20170711133032j:plain

今回調べた遺伝子に載っているpathwayで多く見つかるもの。


FDR < 0.05のread_count.txtを使い、クラスター解析。あらかじめ正規化してある。

count <- read.table("read_count_TMM_cali.txt", sep = "	", header = T, row.names = 1)
count <- as.matrix(count)
rho <- cor(count, method = "spearman")
d <- dist(1 - rho)
h <- hclust(d, method = "ward.D2")
plot(h)

階層クラスタリング | スピアマンの順位相関係数を利用したクラスタリング

f:id:kazumaxneo:20170715124614j:plain

 controlとstressのtriplicateで分類されなかった。普通ならこのデータには何か問題がある可能性がある、となるが今回はアライメントとgtfに穴があるのでそこも怪しい。


NCBI GEOで、DEG判定された遺伝子が、どのような条件で変動する遺伝子なのか調べてみる。

NCBI GEOにアクセス。

https://www.ncbi.nlm.nih.gov/geo/

search by GEO profileに移動(リンク)。

TAIR IDを入れて検索を開始()。

f:id:kazumaxneo:20170712114649j:plain


発現が有意に変動しているトランスクリプトーム実験のデータが表示される。右の方にあるオレンジのバーが、検索した遺伝子の発現量の変化を表す。

どれか1つの実験を選び中に入る。ここでは一番上を選んだ(リンク)。

この実験で変動している遺伝子を調べてみる。下の方にあるCompare 2 sets of samplesをクリック。

f:id:kazumaxneo:20170712115208j:plain

step1、両側t検定を選び、例えばp<0.01を選択。

step2、対象とするデータセットを選択(おかしなデータがない限り、基本全て選択)。

f:id:kazumaxneo:20170712115433j:plain

step3、DEGを検索。

125遺伝子がDEGと検出された(リンク)。検出されたのは全てこの実験のデータであることを確認する。

遺伝子名をダウンロードする。その前に全部収まるよう表示件数を200に変更。

f:id:kazumaxneo:20170712115949j:plain

右のdownloadからダウンロード。

遺伝子名を一括で入手できた。

f:id:kazumaxneo:20170712120126j:plain

pathwayも調べておく。右のpathwayをクリック。

pathwayが10検出された。KEGGでのhitが2(1つは全体図)、REACTOMEが8検出されている。

f:id:kazumaxneo:20170712120321j:plain

どれか1つクリックしてみる。ここではKEGGのsecondary metaboliteを選択。

http://www.kegg.jp/pathway/ath01110

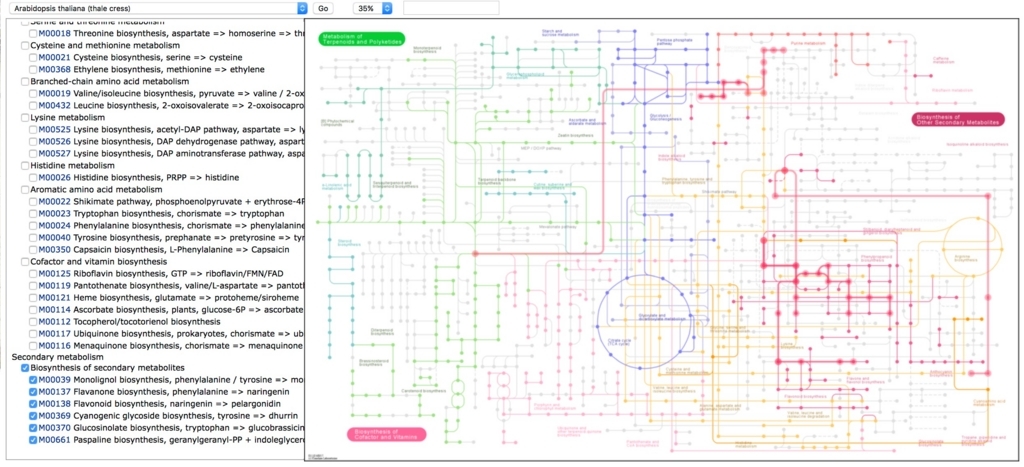
f:id:kazumaxneo:20170712121004j:plain

左端のsecondary metaboliteをクリックして場所を確認する。

f:id:kazumaxneo:20170712121130j:plain

右のほうにある。ここから先はわかりにくいので、kEGG pathwayのtopに移動してsecondary metaboliteで再検索する

Usage

f:id:kazumaxneo:20170712121335j:plain

下の方の

01060 Biosynthesis of plant secondary metabolites

を選択。

f:id:kazumaxneo:20170712121707j:plain

Referenceしかない。研究が不十分でアノテーションが進んでいないようである。


PANTHERでも機能を解析してみる。

PANTHER - Gene List Analysis

リストを入れ、下のFunctional classification viewed in pie chartにチェックをつけてsubmit。

f:id:kazumaxneo:20170712123435j:plain

GOの第一階層を選択する。Biological processを選択した。

f:id:kazumaxneo:20170712123831j:plain

response to stimulus (GO:0050896) explodeというtermも出てきている。


似た機能として、PANTHER Overrepresentation Testなどがあり、top pageから実行できる。

https://www.researchgate.net/post/What_is_the_difference_between_statistical_overrepresentation_test_and_statistical_enrichment_test_in_PANTHER_GO_enrichment_analysis_tools


  • 植物の転写因子データベースPlantTFDB

http://planttfdb.cbi.pku.edu.cn/tf.php?sp=Ath&did=AT3G02310.1

既知転写因子にhitするかどうか、blastで探索することができる(リンク)。同様のサービスとして、PlnTFDBにもBLAST検索機能がある(リンク)。


  • BiomartでID変換(現在工事中らしい)。

http://www.biomart.org (=> ID変換リンク


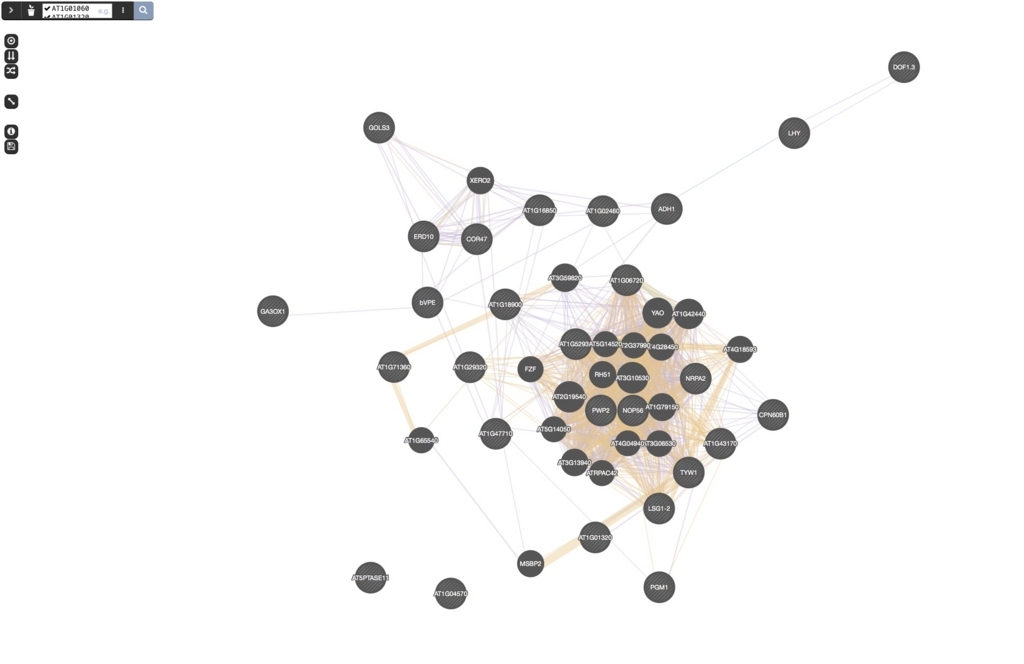
  • 何らかの転写因子や相互作用しそうな遺伝子がDEGとして検出されたら、GeneMANIAで関連する遺伝子を探すのも良い。 

f:id:kazumaxneo:20170712130439j:plain

arabidopsisを選択。遺伝子名で検索できるが、TAIRのIDにも対応している。

f:id:kazumaxneo:20170712130529j:plain

結果は、遺伝子名があるものは遺伝子名で表示される。

f:id:kazumaxneo:20170712131613j:plain

右にedgeの情報源が表示されている。co-expression以外のチェックを外してみる。

f:id:kazumaxneo:20170712131736j:plain

紫の線だけ残る。真ん中のクラスターは共発現することがあるようだ。

f:id:kazumaxneo:20170712131756j:plain


右のカラムを展開すると、どのような実験条件か確認することができる。

f:id:kazumaxneo:20170712131944j:plain

チェックボックスをクリックして、例えば自分の解析に似た実験だけ選んでedgeを確認することができる。右端のリンクから論文を確認できる。

f:id:kazumaxneo:20170712132227j:plain


その他、nodeの上でクリックして、その遺伝子だけで再解析することもできる。

GeneMANIAcytoscapeのpluginもあるようだ。


ヒートマップも書いてみる。ただし、このような2群間比較でヒートマップを書く意味はあまりない。 ヒートマップは、例えば遺伝子Aを壊したA株と遺伝子Bを壊したB株をWTと比較し、 そのfold changeをA/WT、B/WT、で比較して共通のpathway遺伝子などを図示するなどして使う。あくまで忘備録として残しておく。


ここではheatmapなど様々な図を作画できるg.plotsを使う。様々な条件でフィルタリングができるgenefilterも導入する。

まずg.plotsとgenefilterをインストール。

biocLite("genefilter") 
biocLite("gplots")


ライブラリをロード。

library(genefilter) 
library(gplots)


読み込むデータはedgeRで検定し、TMM正規化したカウントデータ。FDR<0.05でなくp< 0.05を全て使う。読み込むデータは以下のようなフォーマットになっている。1行目は各列の注釈、1列目は遺伝子名となっている。

Geneid control1 control2 control3 stress1 out stress3
AT1G01060 2 15 3 152 15 104
AT1G01100 1002 1147 859 4031 1147 2427
AT1G01320 72 170 112 715 170 624
AT1G01390 1 20 6 24 20 38
AT1G01470 4 7 1 34 7 68
AT1G01580 6 10 8 32 10 22
AT1G01790 197 481 240 948 481 690
AT1G01950 18 50 30 74 50 67
AT1G02370 1 5 1 12 5 14
AT1G02460 3 4 2 75 4 58
AT1G02690 12 23 17 60 23 53
AT1G02780 1400 3271 1973 8204 3271 6250
AT1G02870 12 53 27 82 53 69
AT1G02920 430 346 773 81 346 259
AT1G02952 204 198 168 38 198 34
AT1G03110 42 67 52 225 67 145
AT1G03360 15 31 11 63 31 35
AT1G03530 4 12 10 46 12 28

ファイル名はFDR0.05.txtとした。


データを読み込む。

data <- read.delim("result_FDR0.05.txt", header=TRUE, row.names=1)

先ほどcountとして読み込んだデータが残っているなら、それでもよい。 


gplotsのheatmapを使う。データは行列でないといけないので、as.matrixで変換している。

heatmap(as.matrix(data), margin=c(6,4), main="Heat Map 1 (Raw Data)")
  • margin numeric vector of length 2 containing the margins
  • main, xlab, ylab main, x- and y-axis titles; defaults to none.

以下のようになった。

f:id:kazumaxneo:20170715124757j:plain

一部の強い発現に引っ張られており、一部の条件だけ真っ赤になっている。


z-スコア(解説リンク)に変えた方がクラスタリングは綺麗になる。genefilterのgenescaleを使い、Zスコアに変換。

data.z <- genescale(data, axis=1, method="Z")
  • axis An integer indicating which axis of m to scale.
  • method Either "Z" or "R", indicating whether a Z scaling or a range scaling should be performed.

改めてヒートマップを描画。

heatmap(as.matrix(data.z), margin=c(6,4), main="Heat Map 2")

f:id:kazumaxneo:20170715124855j:plain

Zーscore化する前は強い変動をしている遺伝子にクラスタリング引っ張られてしまっていたが、それが無くなっている。


heatmap.2(as.matrix(data.z), col=greenred(75), scale="none", key=TRUE, symkey=FALSE, density.info="none", trace="none", cexRow=1, margin=c(6,8), main="Heat Map 3", Colv=NA)
  • col colors used for the image. Defaults to heat colors (heat.colors).
  • scale character indicating if the values should be centered and scaled in either the row direction or the column direction, or none. The default is "none".
  • key logical indicating whether a color-key should be shown.
  • symkey Boolean indicating whether the color key should be made symmetric about 0. Defaults to TRUE if the data includes negative values, and to FALSE otherwise.
  • density.info character string indicating whether to superimpose a 'histogram', a 'density' plot, or no plot ('none') on the color-key.
  • trace character string indicating whether a solid "trace" line should be drawn across 'row's or down 'column's, 'both' or 'none'. The distance of the line from the center of each color-cell is proportional to the size of the measurement. Defaults to 'column'.
  • cexRow, cexCol positive numbers, used as cex.axis in for the row or column axis labeling. The defaults currently only use number of rows or columns, respectively.
  • Colv determines if and how the column dendrogram should be reordered. Has the options as the Rowv argument above and additionally when x is a square matrix, Colv="Rowv" means that columns should be treated identically to the rows.

f:id:kazumaxneo:20170715124951j:plain


 heatmapのリンクには様々なheatmapの例が載っている。コピペするだけで図が書けるので、好みの図がどうなコードで書けるのかテストしてみるとよい。


追記

勉強会用資料

引用

edgeR: a Bioconductor package for differential expression analysis of digital gene expression data.

Robinson MD, McCarthy DJ, Smyth GK. 

Bioinformatics. 2010, 26(1):139-40. PubMed Abstract Bioconductor 


クラスタリング 

階層クラスタリング | スピアマンの順位相関係数を利用したクラスタリング


ヒートマップ


DAVIDによるGO解析

DAVID 操作ガイド3 – 遺伝子発現解析(マイクロアレイ解析, RNA-seq)


NCBI GEO


PANTHER

Large-scale gene function analysis with the PANTHER classification system

Huaiyu Mi, Anushya Muruganujan, John T Casagrande & Paul D Thomas

Nature Protocols 8, 1551–1566 (2013) doi:10.1038/nprot.2013.092 Published online 18 July 2013


GO

遺伝子オントロジー | 生物学的プロセス、細胞の構成要素、分子機能


GeneMANIA


2020 11/25 こちらを読んで見てください。


関連