2020 8/4 論文引用追加
出版可能な品質の複数のゲノムトラックを表示するプロットの生成は深刻な課題となる。望ましい正確な数値を作成するには、かなりの労力が必要である。これは通常、手作業で、またはベクターグラフィックソフトウェアを使用して行われる。
pyGenomeTracks (PGT)は、複数のトラックを簡単に組み合わせることができるモジュール式のプロットツールである。再現性が高く、標準化された、高度にカスタマイズされた出版準備の整ったイメージの生成を可能にする。
PGT は https://usegalaxy.eu のグラフィカルインターフェースとコマンドラインから利用できる。PGT は bioconda チャンネル経由で conda で提供され、pip で提供され、github: https://github.com/deeptools/pyGenomeTracks でオープンに開発されている。
pyGenomeTracksは、高度にカスタマイズ可能な高品質のゲノムブラウザトラックを作成することを目的としている。Hi-Cデータの他、以下のデータからplotを作成することが可能になっている。
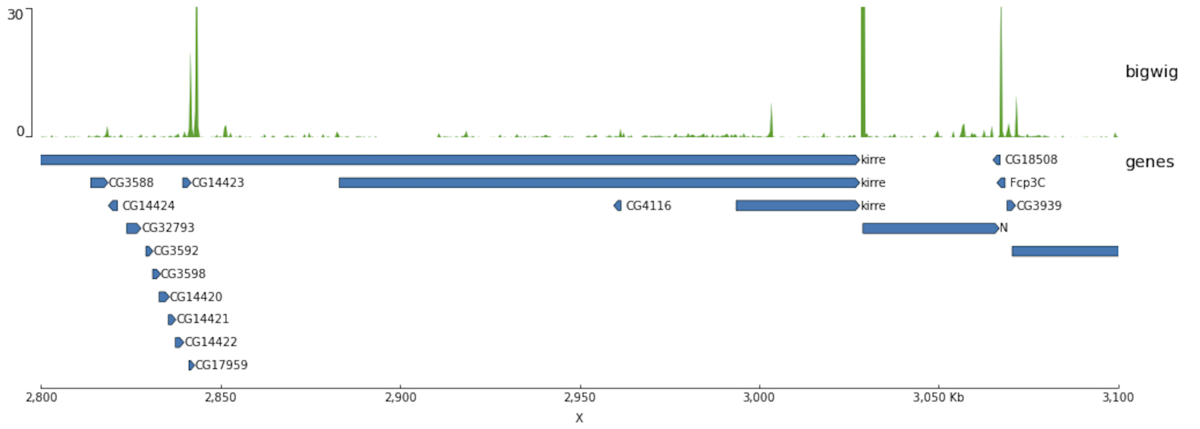
- bigwig
- bed/gtf (many options)
- bedgraph
- epilogos
- narrow peaks
- links (represented as arcs)
- Hi-C matrices
Documentation
example
Galaxy
インストール
依存
- Python >=3.6
- numpy >= 1.16
- intervaltree >=2.1.0
- pyBigWig >= 0.3.4
- hicmatrix >= 0.14
- pysam >= 0.8
- matplotlib >= 3.1.1
- gffutils >=0.9
本体 Github
https://github.com/deeptools/pyGenomeTracks
#bioconda (link)
conda create -n pygenometracks-env -y
conda activate pygenometracks-env
conda install -c bioconda -c conda-forge pygenometracks

#pip
pip install pyGenomeTracks
> pygenometracks -h
$ pygenometracks -h
usage: pygenometracks --tracks tracks.ini --region chr1:1000000-4000000 -o image.png
Plots genomic tracks on specified region(s). Citation : Ramirez et al. High-
resolution TADs reveal DNA sequences underlying genome organization in flies.
Nature Communications (2018) doi:10.1038/s41467-017-02525-w
optional arguments:
-h, --help show this help message and exit
--tracks TRACKS File containing the instructions to plot the tracks.
The tracks.ini file can be genarated using the
`make_tracks_file` program.
--region REGION Region to plot, the format is chr:start-end
--BED BED Instead of a region, a file containing the regions to
plot, in BED format, can be given. If this is the
case, multiple files will be created using a prefix
the value of --outFileName
--width WIDTH figure width in centimeters
--height HEIGHT Figure height in centimeters. If not given, the figure
height is computed based on the heights of the tracks.
If given, the track height are proportionally scaled
to match the desired figure height.
--title TITLE, -t TITLE
Plot title
--outFileName OUTFILENAME, -out OUTFILENAME
File name to save the image, file prefix in case
multiple images are stored
--fontSize FONTSIZE Font size for the labels of the plot
--dpi DPI Resolution for the image in case the ouput is a raster
graphics image (e.g png, jpg)
--trackLabelFraction TRACKLABELFRACTION
By default the space dedicated to the track labels is
0.05 of the plot width. This fraction can be changed
with this parameter if needed.
--trackLabelHAlign {left,right,center}
By default, the horizontal alignment of the track
labels is left. This alignemnt can be changed to right
or center.
--version show program's version number and exit
実行方法
1、trackファイルの作成
git clone https://github.com/deeptools/pyGenomeTracks.git
cd pyGenomeTracks/examples/
make_tracks_file --trackFiles input1.bed input2.bw -o tracks.ini
2、trackファイルと描画領域を指定してpyGenomeTracksを実行
pyGenomeTracks --tracks track.ini --region chr1:1000-20000 -o bigwig.png
テストラン
exampleランのコードをそのまま走らせてみる。
pyGenomeTracks --tracks bigwig_track.ini --region X:2,500,000-3,000,000 -o bigwig.png

pyGenomeTracks --tracks bigwig_with_genes.ini --region X:2,800,000-3,100,000 -o bigwig_with_genes.png

pyGenomeTracks --tracks narrow_peak2.ini --region X:2760000-2802000 --trackLabelFraction 0.2 --dpi 130 -o master_narrowPeak23.png

pyGenomeTracks --tracks hic_track.ini -o hic_track.png --region chrX:2500000-3500000

引用
High-resolution TADs reveal DNA sequences underlying genome organization in flies
Fidel Ramírez, Vivek Bhardwaj, Laura Arrigoni, Kin Chung Lam, Björn A. Grüning, José Villaveces, Bianca Habermann, Asifa Akhtar & Thomas Manke
Nature Communications volume 9, Article number: 189 (2018)
2020 8/4
pyGenomeTracks: reproducible plots for multivariate genomic data sets
Lucille Lopez-Delisle, Leily Rabbani, Joachim Wolff, Vivek Bhardwaj, Rolf Backofen, Björn Grüning, Fidel Ramírez, Thomas Manke
Bioinformatics, Published: 03 August 2020
関連