macでインフォマティクス

macでインフォマティクス

HTS (NGS) 関連のインフォマティクス情報についてまとめています。

マルチプルシーケンスアラインメントを行う Clustal Omega


 Clustal Omega は、複数配列のアラインメント(MSA)を作成するためのパッケージである。利用可能な配列数が大幅に増加していることと、大きな配列を迅速かつ正確に作成する必要性に対応するために、約10年前に開発された。過去30年間で最も広く使われてきたMSA作成パッケージはClustal W2とClustal X3であったが、その間に100以上のMSAパッケージがリリースされている。これらのパッケージは大まかに二つの主要なグループに分類される:高速で非常に大きなアラインメントを作成できるものと、より正確でより少ない配列数に限定されたものである。MUSCLEとMAFFTは前者の例として広く使われているが、T-CoffeeとMAFFT L-INS-iは後者の例である。Clustal W と Clustal X は、パーソナルコンピュータやサーバーでの利用が可能であること、コードの堅牢性と移植性、そして非常に柔軟で直感的なユーザーインターフェースのために広く利用されている。Clustal Omega を設計した当初の動機は、精度を犠牲にすることなく、非常に大規模なアライメントを行うことができるパッケージを作ることであった。

 最初の Clustal パッケージは高速でシンプルな "ガイドツリー "を作成する方法を特徴としていた。これらは配列のクラスタリングであり、後のプログレッシブアラインメント段階でアラインメントの順序を決定するために使用される。Clustal は、1970 年代に最初に完全自動化された MSA 法にまで遡る関連する手法の一例です 。一般的な考え方としては、単に2つの配列のアラインメントから始め、通常はデータセットの中で最も近い配列のアラインメントから始める。その後、ガイドツリーのトポロジーに従って、互いに、または配列をアラインメントにアラインメントすることによって、アラインメントが構築される。ガイドツリー構築の複雑さは、すべてのN個の配列を互いに比較しなければならないため、N個の配列については通常O(N2)となる。Clustal の初期のバージョンでは、これらの比較に高速なワードベースのアラインメントを使用していたため、メモリ効率が良く、PC や Macintosh コンピュータでも十分に高速に動作した。しかし、配列数が数千以上になると、O(N2)の複雑さに時間がかかり、非常に大きなアラインメントを行うことが困難になる。著者らは、配列のアラインメントスコアの計算を NLog(N)に限定することで、何十万もの配列のガイドツリーを作成できる mBed,10 と呼ばれる O(NlogN)法を開発した。このmBed法はClustal Omegaで使用されているもので、非常に大規模なデータセットに対応するためのキャパシティとスケーラビリティを提供する。

 Clustal Omegaの第二の主な開発は、従来の動的プログラミングとプロファイルアライメントの代わりに、プロファイル隠れマルコフモデル(HMM)を互いにアライメントするためのアライメントエンジンを使用することであった。著者らは、プロファイルHMMのアライメントに非常に高い精度を持つことが示されているHHalignを使用した。これにより、構造ベースのアライメントベンチマークで測定された初期のClustalプログラムと比較して、Clustal Omegaの精度が大幅に向上した。新しいプログラムには、以前のClustalプログラムからのオリジナルコードのうち、わずかな量だけが使用された:高速ワードベースのペアワイズアライメントルーチンである。残りのコードはスクラッチから新たにコード化されたものか、一般に公開されているライブラリから抜粋されたものである。

 これにより、精度を落とすことなく何千もの配列をアラインメントすることができる全く新しいプログラムができた。2011年にリリースされ、オープンソースライセンスのもと、すべてのソースコードを自由にダウンロードすることができる。ユーザーは、ほとんどのオペレーティングシステム用の実行ファイルをダウンロードしたり(www.clustal.org)、多くのサイト、特にEMBL European Bioinformatics Institute (www.ebi.ac.uk)でオンラインでプログラムを使用できる。この論文では、Clustal Omega のオリジナルリリースから追加されたいくつかの機能について説明し、二次構造予測の精度に基づくタンパク質ベンチマークを用いて、様々なプログラムオプションのベンチマーク結果を紹介する。


インストール

macos10.14のanaconda3 (python3.7) 環境で、condaを使って導入した。

HP

#bioconda(link)
mamba create -n clustalo python=3.8 -y
conda activate clustalo
mamba install -c bioconda clustalo -y

clustalo --help

$ clustalo --help

Clustal Omega - 1.2.4 (AndreaGiacomo)


If you like Clustal-Omega please cite:

 Sievers F, Wilm A, Dineen D, Gibson TJ, Karplus K, Li W, Lopez R, McWilliam H, Remmert M, Söding J, Thompson JD, Higgins DG.

 Fast, scalable generation of high-quality protein multiple sequence alignments using Clustal Omega.

 Mol Syst Biol. 2011 Oct 11;7:539. doi: 10.1038/msb.2011.75. PMID: 21988835.

If you don't like Clustal-Omega, please let us know why (and cite us anyway).


Check http://www.clustal.org for more information and updates.


Usage: clustalo [-hv] [-i {<file>,-}] [--hmm-in=<file>]... [--hmm-batch=<file>] [--dealign] [--profile1=<file>] [--profile2=<file>] [--is-profile] [-t {Protein, RNA, DNA}] [--infmt={a2m=fa[sta],clu[stal],msf,phy[lip],selex,st[ockholm],vie[nna]}] [--distmat-in=<file>] [--distmat-out=<file>] [--guidetree-in=<file>] [--guidetree-out=<file>] [--pileup] [--full] [--full-iter] [--cluster-size=<n>] [--clustering-out=<file>] [--trans=<n>] [--posterior-out=<file>] [--use-kimura] [--percent-id] [-o {file,-}] [--outfmt={a2m=fa[sta],clu[stal],msf,phy[lip],selex,st[ockholm],vie[nna]}] [--residuenumber] [--wrap=<n>] [--output-order={input-order,tree-order}] [--iterations=<n>] [--max-guidetree-iterations=<n>] [--max-hmm-iterations=<n>] [--maxnumseq=<n>] [--maxseqlen=<l>] [--auto] [--threads=<n>] [--pseudo=<file>] [-l <file>] [--version] [--long-version] [--force] [--MAC-RAM=<n>]


A typical invocation would be: clustalo -i my-in-seqs.fa -o my-out-seqs.fa -v

See below for a list of all options.


Sequence Input:

  -i, --in, --infile={<file>,-} Multiple sequence input file (- for stdin)

  --hmm-in=<file>           HMM input files

  --hmm-batch=<file>        specify HMMs for individual sequences

  --dealign                 Dealign input sequences

  --profile1, --p1=<file>   Pre-aligned multiple sequence file (aligned columns will be kept fix)

  --profile2, --p2=<file>   Pre-aligned multiple sequence file (aligned columns will be kept fix)

  --is-profile              disable check if profile, force profile (default no)

  -t, --seqtype={Protein, RNA, DNA} Force a sequence type (default: auto)

  --infmt={a2m=fa[sta],clu[stal],msf,phy[lip],selex,st[ockholm],vie[nna]} Forced sequence input file format (default: auto)


Clustering:

  --distmat-in=<file>       Pairwise distance matrix input file (skips distance computation)

  --distmat-out=<file>      Pairwise distance matrix output file

  --guidetree-in=<file>     Guide tree input file (skips distance computation and guide-tree clustering step)

  --guidetree-out=<file>    Guide tree output file

  --pileup                  Sequentially align sequences

  --full                    Use full distance matrix for guide-tree calculation (might be slow; mBed is default)

  --full-iter               Use full distance matrix for guide-tree calculation during iteration (might be slowish; mBed is default)

  --cluster-size=<n>        soft maximum of sequences in sub-clusters

  --clustering-out=<file>   Clustering output file

  --trans=<n>               use transitivity (default: 0)

  --posterior-out=<file>    Posterior probability output file

  --use-kimura              use Kimura distance correction for aligned sequences (default no)

  --percent-id              convert distances into percent identities (default no)


Alignment Output:

  -o, --out, --outfile={file,-} Multiple sequence alignment output file (default: stdout)

  --outfmt={a2m=fa[sta],clu[stal],msf,phy[lip],selex,st[ockholm],vie[nna]} MSA output file format (default: fasta)

  --residuenumber, --resno  in Clustal format print residue numbers (default no)

  --wrap=<n>                number of residues before line-wrap in output

  --output-order={input-order,tree-order} MSA output order like in input/guide-tree


Iteration:

  --iterations, --iter=<n>  Number of (combined guide-tree/HMM) iterations

  --max-guidetree-iterations=<n> Maximum number of guidetree iterations

  --max-hmm-iterations=<n>  Maximum number of HMM iterations


Limits (will exit early, if exceeded):

  --maxnumseq=<n>           Maximum allowed number of sequences

  --maxseqlen=<l>           Maximum allowed sequence length


Miscellaneous:

  --auto                    Set options automatically (might overwrite some of your options)

  --threads=<n>             Number of processors to use

  --pseudo=<file>           Input file for pseudo-count parameters

  -l, --log=<file>          Log all non-essential output to this file

  -h, --help                Print this help and exit

  -v, --verbose             Verbose output (increases if given multiple times)

  --version                 Print version information and exit

  --long-version            Print long version information and exit

  --force                   Force file overwriting


実行方法

比較対象の配列のmulti-fastaを指定する。

#protein
clustalo -t Protein -i input_proteins.fa -o alinged.fa

#DNA
clustalo -t DNA -i input_DNA.fa -o alinged.fa

#RNA
clustalo -t RNA -i input_RNA.fa -o alinged.fa

#auto
clustalo -t RNA -i input.fa -o alinged.fa
  • -t, --seqtype={Protein, RNA, DNA}   Force a sequence type (default: auto)
  • -i     Multiple sequence input file (- for stdin)
  • -o    Multiple sequence alignment output file (default: stdout)
  • --threads    Number of processors to use (OpenMPが必要)
  • --auto    Set options automatically (might overwrite some of your options)  


--distmat-out”フラグを立て出力ファイル名を指定することで、多重整列結果以外に距離行列ファイルが出力される。"--percent-id"をつけることで距離が percent identities (%)になる。

clustalo --full --percent-id --distmat-out=output.distmat -i input.fa -o output.aln
  • --full     Use full distance matrix for guide-tree calculation (might be slow; mBed is default)
  • --full-iter    Use full distance matrix for guide-tree calculation during iteration (might be slowish; mBed is default)
  • --percent-id     convert distances into percent identities (default no)
  • -distmat-out    Pairwise distance matrix output file (距離行列時は使用不可)

このオプションはAll versus allの配列比較の距離行列ファイルを得たい時にも役立つ。


EMBOSSにも同様の機能のコマンドdistmatがある。

引用
 Clustal Omega for making accurate alignments of many protein sequences

Fabian Sievers, Desmond G Higgins

Protein Sci. 2018 Jan;27(1):135-145


Fast, scalable generation of high-quality protein multiple sequence alignments using Clustal Omega

Fabian Sievers, Andreas Wilm, David Dineen, Toby J Gibson, Kevin Karplus, Weizhong Li, Rodrigo Lopez, Hamish McWilliam, Michael Remmert, Johannes Söding, Julie D Thompson, Desmond G Higgins

Mol Syst Biol. 2011 Oct 11;7:539


参考

Question: Make matrix of protein pairwise identities/similarities from multiple protein sequences

https://www.biostars.org/p/301422/


bioinformatics


関連


リアルデータに忠実なショートリードをシミュレートする ReSeq

2021 2/20 論文引用、condaによるインストール追記

2021 3/1 追記

2021 5/25 エラーについて追記


 ハイスループットのシーケンシングデータでは、生データから科学的な結果に至るまでのデータ処理において、計算ツール間の性能比較は、情報に基づいた意思決定を行うために不可欠である。シミュレーションは手法比較の重要な要素だが、標準的なIlluminaのゲノムDNAシークエンシングの場合、シミュレーションは単純化されすぎていることが多く、ほとんどのツールでは楽観的な結果になってしまう。
 ReSeqは、実際のデータから重要な成分を抽出して再現することで、合成データの信頼性を向上させる。主な改良点は、システマティックなエラー、フラグメントベースのカバレッジモデル、2次元のマージンに基づくサンプリングマトリクスの推定値を含めることである。これらの改良により、元のk-merスペクトルをより良く表現し、より忠実な性能評価が可能になった。ReSeqとそのすべてのコードはhttps://github.com/schmeing/ReSeqから入手できる。


インストール 

swigの導入でコンフリクトが起きたため、ubuntu18.04のdockerイメージを使ってテストした (*1)。

ビルド依存

Github

git clone https://github.com/schmeing/ReSeq.git
cd ReSeq
mkdir build
cd build
cmake ..
make
sudo make install

#2021 22/20 conda (link) (ここでは高速なmamba使用)
mamba install -c bioconda reseq -y

 > ./reseq

# ./reseq    


Program: reseq (REal SEQuence replicator)

Version: 1.0

Contact: Stephan Schmeing <stephan.schmeing@uzh.ch>


Usage:  reseq <command> [options]

Commands:

  getRefSeqBias stores reference sequence bias from reseq statistic files in tsv format

  illuminaPE simulates illumina paired-end data

  replaceN replaces N's in reference

  test tests the program

./reseq getRefSeqBias

# ./reseq getRefSeqBias

>>> 26-07-20 18:53:13: info:  Running ReSeq version 1.0 in getRefSeqBias mode

!!! int main(int, char**) [/home/ReSeq/reseq/main.cpp:470]: error: ref option is mandatory.

Usage:  reseq getRefSeqBias -r <ref.fa> -s <stats.reseq> -o <out.tsv>

General:

  -h [ --help ]             Prints help information and exits

  -j [ --threads ] arg (=0) Number of threads used (0=auto)

  --verbosity arg (=4)      Sets the level of verbosity (4=everything, 

                            0=nothing)

  --version                 Prints version info and exits


getRefSeqBias:

  -o [ --output ] arg       Output file for the reference sequence bias (tsv 

                            format)

  -r [ --ref ] arg          Reference sequences in fasta format (gz and bz2 

                            supported)

  -s [ --stats ] arg        Reseq statistics file to extract reference sequence

                            bias

> ./reseq illuminaPE


# ./reseq illuminaPE

>>> 26-07-20 18:53:37: info:  Running ReSeq version 1.0 in illuminaPE mode

>>> 26-07-20 18:53:37: info:  Detected 56 cores to be used.

!!! int main(int, char**) [/home/ReSeq/reseq/main.cpp:690]: error: refIn or refSim option mandatory.

Usage:  reseq illuminaPE -b <file.bam> -r <ref.fa> -1 <file1.fq> -2 <file2.fq> [options]

General:

  -h [ --help ]                         Prints help information and exits

  -j [ --threads ] arg (=0)             Number of threads used (0=auto)

  --verbosity arg (=4)                  Sets the level of verbosity 

                                        (4=everything, 0=nothing)

  --version                             Prints version info and exits


Stats:

  --adapterFile arg                     Fasta file with adapter sequences 

                                        [(AutoDetect)]

  --adapterMatrix arg                   0/1 matrix with valid adapter pairing 

                                        (first read in rows, second read in 

                                        columns) [(AutoDetect)]

  -b [ --bamIn ] arg                    Position sorted bam/sam file with reads

                                        mapped to refIn

  --binSizeBiasFit arg (=100000000)     Reference sequences large then this are

                                        split for bias fitting to limit memory 

                                        consumption

  --maxFragLen arg (=2000)              Maximum fragment length to include 

                                        pairs into statistics

  --minMapQ arg (=10)                   Minimum mapping quality to include 

                                        pairs into statistics

  --noBias                              Do not perform bias fit. Results in 

                                        uniform coverage if simulated from

  --noTiles                             Ignore tiles for the statistics 

                                        [default]

  -r [ --refIn ] arg                    Reference sequences in fasta format (gz

                                        and bz2 supported)

  --statsOnly                           Only generate the statistics

  -s [ --statsIn ] arg                  Skips statistics generation and reads 

                                        directly from stats file

  -S [ --statsOut ] arg                 Stores the real data statistics for 

                                        reuse in given file [<bamIn>.reseq]

  --tiles                               Use tiles for the statistics

  -v [ --vcfIn ] arg                    Ignore all positions with a listed 

                                        variant for stats generation


Probabilities:

  --ipfIterations arg (=200)            Maximum number of iterations for 

                                        iterative proportional fitting

  --ipfPrecision arg (=5)               Iterative proportional fitting 

                                        procedure stops after reaching this 

                                        precision (%)

  -p [ --probabilitiesIn ] arg          Loads last estimated probabilities and 

                                        continues from there if precision is 

                                        not met [<statsIn>.ipf]

  -P [ --probabilitiesOut ] arg         Stores the probabilities estimated by 

                                        iterative proportional fitting 

                                        [<probabilitiesIn>]

  --stopAfterEstimation                 Stop after estimating the probabilities


Simulation:

  -1 [ --firstReadsOut ] arg            Writes the simulated first reads into 

                                        this file [reseq-R1.fq]

  -2 [ --secondReadsOut ] arg           Writes the simulated second reads into 

                                        this file [reseq-R2.fq]

  -c [ --coverage ] arg (=0)            Approximate average read depth 

                                        simulated (0 = Corrected original 

                                        coverage)

  --errorMutliplier arg (=1)            Divides the original probability of 

                                        correct base calls(no substitution 

                                        error) by this value and renormalizes

  --methylation arg                     Extended bed graph file specifying 

                                        methylation for regions. Multiple score

                                        columns for individual alleles are 

                                        possible, but must match with vcfSim. 

                                        C->T conversions for 1-specified value 

                                        in region.

  --numReads arg (=0)                   Approximate number of read pairs 

                                        simulated (0 = Use <coverage>)

  --readSysError arg                    Read systematic errors from file in 

                                        fastq format (seq=dominant error, 

                                        qual=error percentage)

  --recordBaseIdentifier arg (=ReseqRead)

                                        Base Identifier for the simulated fastq

                                        records, followed by a count and other 

                                        information about the read

  --refBias arg                         Way to select the reference biases for 

                                        simulation (keep [from refIn]/no 

                                        [biases]/draw [with replacement from 

                                        original biases]/file) [keep/no]

  --refBiasFile arg                     File to read reference biases from: One

                                        sequence per file (identifier bias)

  -R [ --refSim ] arg                   Reference sequences in fasta format to 

                                        simulate from [<refIn>]

  --seed arg                            Seed used for simulation, if none is 

                                        given random seed will be used

  -V [ --vcfSim ] arg                   Defines genotypes to simulate alleles 

                                        or populations

  --writeSysError arg                   Write the randomly drawn systematic 

                                        errors to file in fastq format 

                                        (seq=dominant error, qual=error 

                                        percentage)

./reseq replaceN

# ./reseq replaceN

>>> 26-07-20 18:54:09: info:  Running ReSeq version 1.0 in replaceN mode

>>> 26-07-20 18:54:09: info:  Detected 56 cores to be used.

!!! int main(int, char**) [/home/ReSeq/reseq/main.cpp:555]: error: refIn option is mandatory.

Usage:  reseq replaceN -r <refIn.fa> -R <refSim.fa> [options]

General:

  -h [ --help ]             Prints help information and exits

  -j [ --threads ] arg (=0) Number of threads used (0=auto)

  --verbosity arg (=4)      Sets the level of verbosity (4=everything, 

                            0=nothing)

  --version                 Prints version info and exits


ReplaceN:

  -r [ --refIn ] arg        Reference sequences in fasta format (gz and bz2 

                            supported)

  -R [ --refSim ] arg       File to where reference sequences in fasta format 

                            with N's randomly replace should be written to

  --seed arg                Seed used for replacing N, if none is given random 

                            seed will be used


テスト

> ./reseq test

f:id:kazumaxneo:20200726185715p:plain


実行方法 

1、リアルデータをリファレンスゲノムにマッピングする。

bowtie2-build my_reference.fa my_reference
bowtie2 -p 32 -X 2000 -x my_reference -1 my_data_1.fq -2 my_data_2.fq | samtools sort -m 10G -@ 4 -T _tmp -o my_mappings.bam -


2、ReSeq illuminaPEを実行する。

reseq illuminaPE -j 32 -r my_reference.fa -b my_mappings.bam -1 my_simulated_data_1.fq -2 my_simulated_data_2.fq
  • -1     Writes the simulated first reads into this file [reseq-R1.fq]
  • -2     Writes the simulated second reads into this file [reseq-R2.fq]
  • -j       Number of threads used (0=auto)

  •  

エラーが起きる。ランできるようになったら追記します。 

=>20210301に condaを使ってubuntu18.04の計算機に導入し直した。問題なくランできた。


引用

ReSeq simulates realistic Illumina high-throughput sequencing data

Stephan Schmeing, Mark D. Robinson

bioRxiv, Posted July 17, 2020


2021 2/20

ReSeq simulates realistic Illumina high-throughput sequencing data

Stephan Schmeing & Mark D. Robinson
Genome Biology volume 22, Article number: 67 (2021)


*1

新規ubuntuイメージを立ち上げ、依存ライブラリを導入後ビルドした。

cd data_dir
docker run -itv $PWD:/data ubuntu

apt update && apt install swig build-essential zlib1g-dev python-dev git cmake libboost-all-dev

#clone from the ReSeq repository
git clone https://github.com/schmeing/ReSeq.git
cd ReSeq
mkdir build
cd build
cmake ..
make


dockerhubのイメージ ( ランできることは確認しています。bowtie2はホスト側でランして下さい)

https://hub.docker.com/r/cristaniguti/reseq/tags?page=1&ordering=last_updated

docker pull cristaniguti/reseq:latest


error

!!! T& reseq::utilities::at(seqan::String<TString>&, size_t) [with T = seqan::SimpleType<unsigned char, seqan::Dna_>; size_t = long unsigned int] [/ReSeq/reseq/utilities.hpp:132]: error: Called position 9. String size is only 9.

が起きたので、--adapterFile TruSeq_singleをつけてランした(参考)。

#step1
reseq illuminaPE -j 12 -r ref.fa -b my_mappings.bam --statsOnly --adapterFile TruSeq_singlemy_simulated_data_1.fq -2 my_simulated_data_2.fq

#step2
reseq illuminaPE -j 12 -s my_mappings.bam.reseq --stopAfterEstimation

#step3
reseq illuminaPE -j 12 -R ref.fa -s my_mappings.bam.reseq --ipfIterations 0 -1 my_simulated_data_1.fq -2 my_simulated_data_2.fq


全てのk-mer配列を含み二次構造を作らないRNA配列を設計する CURLCAKE


タンパク質とRNAの結合は、RNAの配列と構造の両方を介して媒介され、神経変性疾患を含む多くの細胞プロセスにおいて重要な役割を果たしている。RNA結合タンパク質の配列と構造の結合嗜好性をモデル化することは、計算上の重要な課題である。正確なモデル化を行うことで、新たな相互作用の予測や結合機構の理解を深めることが可能になる。さらに、これらの相互作用を実験的に測定するためのコンパクトで効率的な配列ライブラリを設計することが、新しい結合選好性を発見するために必要である。本講演では、これら2つの課題を解決するための研究成果を紹介する。最初の部分では、k-merに基づいた配列と構造のスコアを学習する効率的なアルゴリズムであるRCKについて説明する。また、RCKをタンパク質-RNA相互作用の最大のデータセットに適用することで得られる新しい生物学的洞察の例を紹介する。第二部では、すべてのk-merをカバーする非構造化RNA配列の最小サイズの集合を生成する問題について考察する。この問題の一般的な定義がNP-hardであることを証明し、この問題を解決するためのgreedyなヒューリスティック手法であるCurlCAKEについて説明する。


CURLCAKEは、すべてのK-mErsをカバーするコンパクトな非構造化RNAライブラリを生成するソフトウェアである。de Bruijnグラフ内の不連続なパスを見つけることに基づいたヒューリスティックアルゴリズムを持つ。パスに対応するRNA配列は、抽象化されていない(すなわち、高いフォールディングエネルギーを有する可能性が高い)。


CURLCAKEは8つのパラメータを入力として受け取る。
1. k - カバーする k値。
2. length - プローブのユニークな部分の長さ.
3. multiplicity - それぞれのk-merが何回発生するかを指定
4. attempts - ランダムな拡張子の試行回数の制限
5. output_incomplete_file - 不完全なプローブシーケンスを出力するファイル名
6. output_compelte_file - 完全なプローブ配列を出力するためのファイル名
7. RNAshapes 実行形式ファイル (バージョン 2.1.6) 
8. seed (任意) ランダム性調節。デフォルト: 0


ダウンロード

ubuntu18.04LTSで実行した。

HP

http://wwwee.ee.bgu.ac.il/~cb/software.html

CURLCAKE


http://cb.csail.mit.edu/cb/curlcake/

Get the softwareの下にあるリンクからCURLCAKEとRNAshapesのバイナリ(実行形式ファイル)をダウンロードする。

f:id:kazumaxneo:20200727140106p:plain

RNAshapesは実行権をつけておく。

chmod u+x RNAshapes


実行方法

RNAshapesのバイナリのパスを指定してcurlcake.jarを実行する。

35 merのRNA配列を出力する。

java -jar curlcake.jar 7 35 1 100 incomplete.txt complete.txt ./RNAshapes 0

 2つのシーケンスファイルをテキストファイルとして出力する。 


incomplete.txt(不完全)

f:id:kazumaxneo:20200727205322p:plain


 complete.txt

f:id:kazumaxneo:20200727205300p:plain


引用

https://engineering.biu.ac.il/node/8463


RNAshapes

https://bibiserv.cebitec.uni-bielefeld.de/rnashapes


ONTのデバイスは5-mer単位で塩基配列の電流変化を測定する。可能性のあるすべての 5-mer組み合わせの配列を含み、さらに二次構造を作らない合成コンストラクト配列を設計するため、以下の論文で使用された(5-merの系統的な違いを調べるため)。

Accurate detection of m 6 A RNA modifications in native RNA sequences | Nature Communications


関連


(コムギなど)倍数性ゲノムのホモログ特異的なプライマーを自動作成する AutoCloner

2020 7/27 誤字修正


 小麦のような倍数性の生物は、分子生物学の最も単純な手順さえも複雑にしている。農作物のゲノム配列に関する知識は急速に増加しているが、研究者の間では、すべての種の完全な全ゲノムを作成するまでにはまだ長い道のりがある。そのため、ポリメラーゼ連鎖反応やサンガー塩基配列決定法は、多くの品種の作物の遺伝子配列を特徴づけるための方法として広く使われている。ポリプロイドゲノム間の配列類似性が高いということは、3'テイルにSNPを組み込むことでプライマーがホメオログ特異的にならない場合、標的配列以外の配列も増幅されることを意味する。小麦における遺伝子クローニングの現在のコンセンサスは、長いバイオインフォマティクスパイプラインの中で多くのステップを手作業で行うことである。
 ここでは、作物遺伝子クローニングのための完全自動化されたパイプラインであるAutoCloner (www.autocloner.com)を紹介する。AutoClonerは、ユーザーから興味のある配列を受け取り、特定の倍数性の作物ゲノムアセンブリに対して基本的なローカルアラインメント検索ツール(BLAST)検索を実行する。相同な配列は、入力された配列と一緒に、一塩基多型(SNP)のためにマイニングされるマルチプルシークエンスアラインメントにコンパイルされる。次に、関心のある遺伝子全体をカバーする可能性のあるプライマーの様々な組み合わせが作成され、Primer3によって評価される。最も高いスコアを持つプライマーのセット、およびすべてのSNPの位置にある可能性のあるすべてのプライマーは、ポリメラーゼ連鎖反応(PCR)のためにユーザーに返される。現在、ゲノム配列を持たないアポジー小麦品種において、AutoClonerを用いて興味のある様々な遺伝子をクローニングすることに成功した。さらに、小麦ゲノムアセンブリから得られた約80,000の高信頼度遺伝子モデルを用いて、パイプラインを実行することにも成功した。
 AutoClonerは、これまでは手作業で行われていた倍数性の遺伝子クローニングのためのプライマーデザインを完全に自動化した初めてのツールである。AutoClonerのウェブインターフェースは、研究者がソフトウェアをダウンロードしたり、興味のある配列以外の詳細を入力したりする必要がなく、遺伝子クローニングのためのシンプルで効果的な倍数体ゲノムのプライマーデザイン方法を提供する。


GIthub

ローカルで実行することもできる。README.md参照。


webサービス

http://coultona.cyverseuk.org にアクセスする。

f:id:kazumaxneo:20200727002947p:plain


ゲノムを指定する。ここではIWGSC v1.0を指定。

f:id:kazumaxneo:20200727003351p:plain


コムギについては、パンコムギのRobigus、Paragon、Claire、Cadenza、デュラムコムギKronosを含む5つの追加品種のデータも指定してSNPs精度を上げることが可能。

f:id:kazumaxneo:20200727003550p:plain


遺伝子配列を貼り付ける。fastaのヘッダーがあると動作しない。配列だけ貼り付ける。

f:id:kazumaxneo:20200727004155p:plain


Advanced options

f:id:kazumaxneo:20200727004205p:plain


実行する。マルチプルシーケンスアラインメントとBLASTの計算には十分前後かかる。


出力。

f:id:kazumaxneo:20200727010057p:plain


1、Homologues

下のHomologuesではマルチプルシーケンスアラインメントから除く配列を指定できる。ここでは、上のマルチプルシーケンスアラインメントでギャップになっていた配列を除く。

f:id:kazumaxneo:20200727010554p:plain

ゲノムを選択してボタンをクリックする。


除かれた。

f:id:kazumaxneo:20200727010917p:plain


2、SNPs

プライマーの候補となるSNPについて考える前にアラインメントを調べる。ここでは配列同一性の低い領域をマスキングするオプションが選べる。これは、入力配列と比較して配列同一性が低い領域は有効なプライマーターゲットにはならないが、AutoClonerがどの塩基をSNPとして分類するかに影響を与える可能性があるためである。例えば、下の図1の21番目の位置はSNPのように見えるが、最後の配列のアライメントが悪いため、AutoClonerはそれを検出できない。

f:id:kazumaxneo:20200727011024p:plain

アライメントが良さそうであれば、マスキングのチェックを外したままSNP計算を実行する。

SNP Information

f:id:kazumaxneo:20200727011751p:plain


3、Primers

プライマーを設計する。

f:id:kazumaxneo:20200727011840p:plain


出力

Overview

f:id:kazumaxneo:20200727011958p:plain


Primer set1

f:id:kazumaxneo:20200727012013p:plain


Sanger Primers

PCR産物の長さが長い場合のサンガーシークエンシングのための追加のプライマー。各産物の600塩基毎に重なり合う前方プライマーが列挙される。

f:id:kazumaxneo:20200727012023p:plain


引用

AutoCloner: automatic homologue-specific primer design for full-gene cloning in polyploids

Alexander Coulton, Keith J. Edwards
BMC Bioinformatics volume 21, Article number: 311 (2020)


参考

コムギのゲノムを読む

ゲノム研究はコムギ研究とともに始まった

https://www.jstage.jst.go.jp/article/kagakutoseibutsu/55/2/55_105/_pdf


リファレンスフリーでメタゲノムロングリードのビニングを行う MetaBCC-LR


 メタゲノミクスは、微生物の遺伝物質を自然環境から直接研究するものである(Chen and Pachter, 2005)。次世代シーケンシング(NGS)技術により、ヒトマイクロバイオームプロジェクト(The Human Microbiome Project Consortium, 2012)のような大規模な研究が可能になり、大量のショートリードデータを生成してさまざまな環境のシーケンスを行うことが可能になった。微生物群集に存在する個々のゲノムを復元することは、このような研究において重要なステップであり、それは異なる種の機能や行動の特徴付けに役立つからである。このような分析において重要なステップは、リードを異なる種を表す個々のビンにグループ化することである。この作業のためには、ビンの数とリードが属するビンの数を推定する必要があり、多くのビニングツールが設計されている。

 メタゲノミクスのビニングツールには大きく分けて2つのタイプがある。(i)リファレンスベースのビニングと(ii)リファレンスフリーのビニング(taxonomyに依存しない)である。リファレンスベースのビニングツールは、配列類似度などの特徴を利用し、既知のゲノムのデータベース内の配列と比較するもので、例えば、LMAT(Ames et al、2013)、MetaPhlAn(Segata et al、2012)、Kraken(Wood and Salzberg、2014)などがある。リファレンスベースのビニングツールは、データセットが既知の微生物ゲノムで構成されている場合に、非常に正確な結果を生成する。しかし、リファレンスゲノムは未知のものや不完全なものが多く、そのような場合にはこれらのツールを使用することはできない。対照的に、リファレンスフリーのビニングツールは、リファレンスデータベースを使用せずに動作する。これらのツールは、ゲノムシグネチャと配列情報に完全に基づいて、配列をラベルの付いていないビンにグループ化する。例としては、CLAME(Benavides et al、2018)、MetaProb(Girotto et al、2016)、MrGBP(Kouchaki et al、2019)およびOpal(Luo et al、2019)が挙げられる。これらのツールの大部分は、エラー率が非常に低いショートリードを用いて設計され、ベンチマークされている(McIntyre et al、2017; Pearman et al、2019)。

 ショートNGSリードの使用は、個々のゲノム内でのリピートや、異なるゲノム間で共有される類似領域のために、曖昧なアラインメントや断片化されたアセンブリーになりやすい(Pearman et al、2019)。これらの制限を克服するために、メタゲノミクスの分野では、PacBioやONTなどの第三世代シーケンシング技術によって生成されたロングリードデータを、特にメタゲノムアセンブリのために利用することへの関心が高まっていることが示されている(Pearman et al、2019)。しかし、ロングリードリードやエラーが発生しやすいリードからのビニングの精度をベンチマークする研究は限られた数しか行われていない(Pearman et al、2019)。

 ロングリードリードを扱えるビニングツールの中でも、MEGAN-LR(Huson et al、2018)、Centrifuge(Kim et al、2016)、Kaiju(Menzel et al、2016)は、k-merマッチング、インデキシング、アライメントのためにリファレンスデータベースが必要なリファレンスベースのビニングを行う。ツールMetaProb(Girotto et al、2016)およびBusyBee Web(Laczny et al、2017)は、ロングリードのリファレンスフリーのビニングをサポートする。しかし、MetaProb(Girotto et al、2016)の現在の実装は、大規模で未知のロングリードデータセットをビニングするためにうまくスケールできず、一方、BusyBee Web(Laczny et al、2017)は、現在、ウェブベースのツールとして利用可能であり、入力データセットのサイズに制限がある。著者らの知る限りでは、大規模なロングリードデータセットを正確にビニングすることができるリファレンスフリーのツールは存在しない。

 ショートリードでは十分な種特異的シグナルが含まれていない可能性があるため、別のアプローチとして、より長いコンティグにアセンブルし、コンティグビニングツールを使用することが考えられる[例えば、MetaBAT(Kangら、2015、2019)、MetaWatt(Strousら、2012)、SolidBin(Wangら、2019)、MaxBin 2.0(Wuら、2016)、BMC3C(Yuら、2018)、およびAutometa(Millerら、2019)など]。しかし、これらのツールは、ロングリードをコンティグとして扱うことにより、長いリードをビニングするために直接適用することはできない。第一に、コンティグビニングツールは、各コンティグのカバレッジ情報を必要とするが、そのようなカバレッジ情報は、通常、単一のロングリードに対しては利用できない。第二に、これらのツールはシングルコピーマーカー遺伝子を使用してビン数を決定するが、ロングリードはこのような解析にはエラーが発生しやすく、また(ゲノムのカバレッジが1よりも大きい場合)ビン数が過大評価される可能性がある。第三に、ロングリードデータセットはコンティグデータセットよりもはるかに大規模であり、これらのツールはスケーラビリティの課題に対処することができない。そのため、大規模なロングリードデータセットを正確かつ効率的にビニングできるリファレンスフリーのツールが必要とされている。

 本論文では、メタゲノムのロングリードをビニングするためのスケーラブルなリファレンスフリービニングツールであるMetaBCC-LRを設計した。MetaBCC-LRは、種の豊富さと組成情報をキャプチャする識別特徴を使用して、ビンの数を見つけ出し、各ビンの統計モデルを開発する。これは、入力されたリードのサンプルだけを使用することで達成され、MetaBCC-LRは大規模なデータセットを効率的に扱うことができる。この統計モデルにより、最尤フレームワークを用いて各ロングリードを正確にビンに分類することができる。実験結果は、複数の評価基準を用いて、シミュレーションデータと実データの両方において、最先端のリファレンスフリーのビニングツールよりも大幅に改善されていることを示している。ビニングによって下流のタスクがどのように改善されるかを評価するために、MetaBCC-LRを適用して、大規模なロングリードデータセットを前処理し、ロングリードアセンブリのために個々のビンに読み込んだデータをビン化した。これにより、実行時間とメモリ使用量が大幅に削減されただけでなく、アセンブリの品質も向上した。


インストール

依存

Python dependencies

  • numpy 1.16.4
  • scipy 1.3.0
  • kneed 0.4.2
  • seaborn 0.9.0
  • h5py 2.9.0

C++ requirements

  • GCC version 9.1.0
  • OpenMP 4.5 for multi processing

Third party programs

本体 Github

#ここではpython3.6の仮想環境を作って入れる(3.6とpipも導入している)。
conda create -n metabcc python=3.6 -y
conda activate metabcc
pip install numpy==1.16.4
pip install scipy==1.3.0
pip install kneed==0.4.2
pip install seaborn==0.9.0
pip install h5py==2.9.0
conda install -c bioconda -y dsk

git clone https://github.com/anuradhawick/MetaBCC-LR.git
cd MetaBCC-LR
./build.sh

> ./MetaBCC-LR -h

$ ./MetaBCC-LR -h

usage: MetaBCC-LR [-h] -r <READS PATH> [-t <THREADS>] [-i <IDS>]

                  [-c <No of reads to sample>] [-s <Sensitivity>]

                  [-b <bin width for coverage histograms>]

                  [-m <Max memory for DSK in Mb>] [--resume] -o <DEST>


MetaBCC-LR Help. A tool developed for binning of metagenomics long reads

(PacBio/ONT). Tool utilizes composition and coverage profiles of reads based

on k-mer frequencies to perform dimension reduction. dimension reduced reads

are then clustered using DB-SCAN. Minimum RAM requirement is 9GB.


optional arguments:

  -h, --help            show this help message and exit

  -r <READS PATH>       Reads path (FASTQ)

  -t <THREADS>          Thread limit

  -i <IDS>              Read ids of reads (For dry runs with ground truth)

  -c <No of reads to sample>

                        Number of reads to sample in order to determine the

                        number of bins. Set to 1% of reads by default.

                        Changing this parameter will affect whether low

                        coverage species are separated or not.

  -s <Sensitivity>      Value between 1 and 10, Higher helps recovering low

                        abundant species (No. of species > 100)

  -b <bin width for coverage histograms>

                        Value of bx32 will be the total coverage of k-mers in

                        the coverage histograms. Usually k-mers are shifted

                        towards y-axis due to errors. By defaul b=10;

                        coverages upto 320X

  -m <Max memory for DSK in Mb>

                        Default 5000. DSK k-mer counter accepts a max memory

                        parameter. However, the complete pipeline requires

                        5GB+ RAM. This is only to make DSK step faster, should

                        you have more RAM.

  --resume              Continue from the last step or the binning step (which

                        ever comes first). Can save time needed to run DSK and

                        obtain k-mers. Ideal for sensitivity tuning

  -o <DEST>             Output directory


実行方法

MetaBCC-LR -r input_long_reads.fq -t 20 -o out_dir
  • -r    Reads path (FASTQ)
  • -t    Thread limit

出力

f:id:kazumaxneo:20200726151130p:plain


引用

MetaBCC-LR: metagenomics binning by coverage and composition for long reads

Anuradha Wickramarachchi, Vijini Mallawaarachchi, Vaibhav Rajan, Yu Lin

Bioinformatics. 2020 Jul 1;36(Supplement_1):i3-i11


関連


エラーの多いロングリードのハイブリッドエラーコレクションツール Ratatosk

2020 7/26 追記

2022/06/03 help更新


 全ゲノムシークエンシングのルーチン化には、ショートリードシークエンシング(SRS)技術を補完するロングリードシークエンシング(LRS)技術が不可欠になってきている。LRSプラットフォームは103 から106塩基のDNAフラグメントリードを生成するため、ゲノムの再構成や解析のためにSRSリードで残された多くの不確実性を解決することができる。特に、LRSはリードの長さが短いSRSでは検出できなかった長くて複雑な構造変異を特徴づけることができる。さらに、LRSリードを用いて作成されたアセンブリは、これまでアクセスできなかったテロメリック領域やセントロメリック領域にまたがっているため、SRSリードを用いた場合よりもかなり連続したものになる。しかし、LRSリードを採用する上での大きな課題は、SRSリードに比べてエラー率が最大15%と非常に高いことであり、下流の解析パイプラインに障害をもたらすことになる。

 正確なショートリードから構築された圧縮されたcolored de Bruijn graph に基づいて、エラーのあるロングリードに対する新しいエラー修正手法であるRatatoskを紹介する。ショートリードとロングリードはグラフ内のパスに色を付け、頂点には候補となる一塩基多型アノテーションされている。ロングリードはその後、正確または非正確なfc-merマッチを使用してグラフに固定され、修正された配列に対応するパスを見つける。Ratatoskは、オックスフォード・ナノポア・リードの生のエラー率を平均6倍削減し、エラー率の中央値は0.28%に抑えられることを実証した。Ratatoskで補正されたデータは、ほぼ99%の精度のSNPコールを維持し、生データと比較してindelコールの精度を最大約40%向上させる。Ratatoskで修正されたOxford Nanoporeリードから作成されたAshkenazi個体HG002のアセンブリでは、コンティグN50が43.22 Mbpとなり、PacBio HiFiリードを使用した高品質のLRSアセンブリを上回る結果が得られた。特に、Ratatoskで修正済みリードを用いたアセンブリは、PacBio HiFiリードを用いたアセンブリと比較して、約2.5倍もエラーが少なくなった。


インストール

ビルド依存

  • C++11 compiler:
  • GCC >= 4.8.5
  • Clang >= 3.5
  • Cmake >= 2.8.12
  • Zlib

Github

git clone --recursive https://github.com/DecodeGenetics/Ratatosk.git
cd Ratatosk
mkdir build && cd build
cmake ..
make -j
make install

Ratatosk

Ratatosk 0.7.6


Hybrid error correction of long reads using colored de Bruijn graphs


Usage: Ratatosk [COMMAND] [PARAMETERS]

Usage: Ratatosk --help

Usage: Ratatosk --version

Usage: Ratatosk --cite


[COMMAND]:


   correct                         Correct long reads with short reads

   index                           Prepare a Ratatosk index (advanced)


Use "Ratatosk [COMMAND] --help" to get a specific command help


> Ratatosk correct


Ratatosk 0.7.6


Hybrid error correction of long reads using colored de Bruijn graphs


Usage: Ratatosk [COMMAND] [PARAMETERS]

Usage: Ratatosk --help

Usage: Ratatosk --version

Usage: Ratatosk --cite


[COMMAND]: correct


[PARAMETERS]:


   > Mandatory with required argument:


   -s, --in-short                  Input short read file to correct (FASTA/FASTQ possibly gzipped)

                                   List of input short read files to correct (one file per line)

   -l, --in-long                   Input long read file to correct (FASTA/FASTQ possibly gzipped)

                                   List of input long read files to correct (one file per line)

   -o, --out-long                  Output corrected long read file


   > Optional with required argument:


   -c, --cores                     Number of cores (default: 1)

   -S, --subsampling               Rate of short reads subsampling (default: Auto)

   -t, --trim-split                Trim and split bases with quality score < t (default: no trim/split)

                                   Only sub-read with length >= 63 are output if used

   -u, --in-unmapped-short         Input read file of the unmapped short reads (FASTA/FASTQ possibly gzipped)

                                   List of input read files of the unmapped short reads (one file per line)

   -a, --in-accurate-long          Input high quality long read file (FASTA/FASTQ possibly gzipped)

                                   List of input high quality long read files (one file per line)

                                   (Those reads are NOT corrected but assist the correction of reads in input)

   -g, --in-graph                  Load graph file prepared with the index command

   -d, --in-unitig-data            Load unitig data file prepared with the index command


   > Optional with no argument:


   -v, --verbose                   Print information


[ADVANCED PARAMETERS]:


   > Optional with required argument:


   -m, --min-conf-snp-corr         Minimum confidence threshold to correct a SNP (default: 0.9)

   -M, --min-conf-color2           Minimum confidence threshold to color vertices for 2nd pass (default: 0)

   -C, --min-len-color2            Minimum length of a long read to color vertices for 2nd pass (default: 3000)

   -i, --insert-sz                 Insert size of the input paired-end short reads (default: 500)

   -k, --k1                        Length of short k-mers for 1st pass (default: 31)

   -K, --k2                        Length of long k-mers for 2nd pass (default: 63)

   -w, --max-len-weak1             Do not correct non-solid regions >= w bases during 1st pass (default: 1000)

   -W, --max-len-weak2             Do not correct non-solid regions >= w bases during 2nd pass (default: 5000)


   > Optional with no argument:


   -1, --1st-pass-only             Perform *only* the 1st correction pass (default: false)

   -2, --2nd-pass-only             Perform *only* the 2nd correction pass (default: false)


[EXPERIMENTAL PARAMETERS]:


   > Optional with required argument:


   -L, --in-long_raw               Input long read file from 1st pass (FASTA/FASTQ possibly gzipped)

                                   List of input long read files to correct (one file per line)

   -p, --in-short-phase            Input short read phasing file (diploid only)

                                   List of input short read phasing files (one file per line)

   -P, --in-long-phase             Input long read phasing file (diploid only)

                                   List of input long read phasing files (one file per line)


実行方法

de novo correction

修正するロングリードと、修正のためのショートリードを指定する。CPU利用効率が高いので、利用できるならCPUコア数は多めに指定しておく。

Ratatosk correct -v -c 40 -s input_short_reads.fq -l input_long_reads.fq -o out_long_reads.fq

#paired-end
Ratatosk correct -v -c 40 -s pair*.fq.gz -l input_long_reads.fq.gz -o out_long_reads.fq
  • -s    Input short read file to correct (FASTA/FASTQ possibly gzipped). List of input short read files to correct (one file per line)
  • -l     Input long read file to correct (FASTA/FASTQ possibly gzipped). List of input long read files to correct (one file per line)
  • -o    Output corrected long read file
  • -c     Number of cores (default: 1)
  • -q    Output Quality Scores: corrected bases get QS >= t (default: t=0, no output)
  • -t     Trim bases with quality score < t (default: t=0, no trimming)

出力

> seqkit stats

f:id:kazumaxneo:20200726164236p:plain

リード数は変化しない(*1)。


Reference-guided correction 

wikiを参照


引用

Ratatosk – Hybrid error correction of long reads enables accurate variant calling and assembly

Guillaume Holley, Doruk Beyter, Helga Ingimundardottir, Snædis Kristmundsdottir, Hannes P. Eggertsson, Bjarni V. Halldorsson

bioRxiv, Posted July 15, 2020


*1

エラー修正したロングリードを用いて、FLyeによるアセンブリパフォーマンスを簡単に比較した。

条件を揃えるため、エラー修正前のリードとエラー修正後のリードを両方flyeのrawモードでアセンブリしてQUASTで評価した結果が以下になる。右がエラー修正したリードをした時、左がエラー修正前のリードを使用した時のミスマッチ率(リファレンスと比較)。特にindelミスマッチが顕著に減っていた。エラーコレクションツールはパラメータに敏感で扱いづらいものが多いが、Ratatoskは特にエラーも起きず、またランタイムも短いため、とても使いやすかった(単なる感想です)。

f:id:kazumaxneo:20200726190500p:plain


ONTのメチレーションコールを視覚化する Methplotlib

2020 7/24 追記


 DNA配列を変化させないエピジェネティックな共有ヌクレオチド修飾は、トランスポゾンの抑制、発生時の発現調節、インプリンティングされた発現およびX染色体サイレンシングを含む多くの機能を有し(Gigante et al、2019; GreenbergおよびBourc'his、2019)、精神疾患および神経変性などの多くの細胞機能、発生および病理状態において役割を果たすことが知られている(Armstrong et al、2019; Gaine et al、2019)。40種類以上の修飾が検証されており、そのうち5-メチルシトシン(5mC)およびN6-メチルアデニン(m6A)が最も研究されている(Sood et al、2019)。オックスフォード・ナノポア・テクノロジーズ(ONT)からのロングリード・シーケンシング・プラットフォームは、deviating current signalsを評価することによって修飾ヌクレオチドのゲノムワイドな直接観察を可能にし、そのための複数のツールが開発されている(Liu et al., 2019a, b; McIntyre et al., 2019; Rand et al., 2017; Simpson et al., 2017; Stoiber et al., 2016)が、それらの性能の包括的な評価は欠落している。最近のレビューについては、Xu and Seki (2019)を参照されたい。著者らの知る限りでは、このタイプのデータに合わせた柔軟な可視化手法はない。
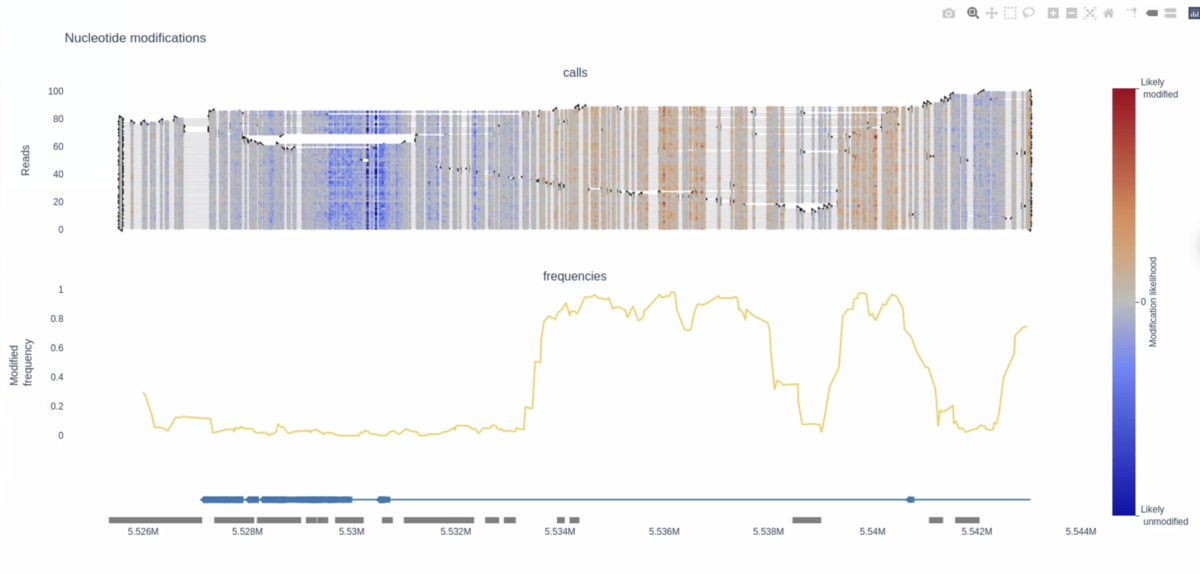
 ヌクレオチド修飾が存在する場合の修飾頻度とヌクレオチドあたりの確率を、追加の概要表示とともに可視化するためのソフトウェアパッケージであるmethplotlibを開発した。ほとんどの仕事はメチル化について行われてきたが、本ツールを用いた可視化は、入力として使用されるヌクレオチド修飾のタイプに本質的に不可知であり、将来の仕事は、例えばヒドロキシメチル化または直接RNAシークエンシングにおける様々なRNA修飾を認識するために上流のツールを訓練するかもしれない(Garalde et al、2018; Leger et al、2019)。執筆時点では、ヌクレオチド修飾のためのコミュニティ標準フォーマットは確立されていない。現在のmethplotlibバージョンは、nanopolish(Simpsonら、2017)またはnanocompore(Legerら、2019)からのタブ分離されたファイルと互換性があり、SAM仕様に従ってMM/MPタグでエンコードされた修飾と互換性がある。APIは、他の形式のデータに対応するために簡単に拡張することができる。遺伝子やトランスクリプトアノテーションはGTFファイルから抽出され、他のタイプのアノテーションはBED形式で追加することができる。

 methplotlibは、Pythonのコアモジュールとnumpy(van der Walt et al、2011)、pandas(McKinney、2011)、scikit-learn(Pedregosa et al、2011)、pyranges(Stovner and Sætrom、2019)、pyfaidx(Shirleyら、2015)およびplotly(Plotly Technologies Inc. PyPIとbioconda(Grüning et al、2018)を介して簡単に利用できるようにした。ビジュアライゼーションは、デフォルトでは動的なHTML形式、またはpng、pdf、SVGなどの他の静的な出力形式で作成され、オプションで複数のサンプルについて、(i)リードの位置ごとのヌクレオチド修飾の生の尤度、(ii)位置ごとの修飾されたヌクレオチドを有する頻度、および(iii)エクソンおよび遺伝子構造を示すアノテーショントラックを示す。実施例(論文図1および補足図)は、Ensemblからの遺伝子アノテーションおよびEncodeからのDNase過敏症を用いて、ヨルバン参照個体NA19240のリンパ芽細胞株からのONT Promethlonデータのナノポリッシュコールメチル化を用いて作成された。図1の例のプロット(23 kbase locus)の生成には30秒未満かかり、1.2 MbのダイナミックHTMLプロットまたは146 Kbの静的PNGプロットを生成する。10倍以上の領域では50秒かかり、11 MbのHTMLファイルが生成される。このように、遺伝子レベルでの可視化には、リードごとの確率が最も適している。リードごとの情報を使わずに、変更の頻度だけに出力を制限すると、より高速で、より小さなファイルが得られ、より大きな領域に適している。IGV (Thorvaldsdóttir et al., 2013)やGenomeBrowseのような他のゲノムブラウザは、例えば修飾された位置の頻度をプロットするためにある程度同様の機能を提供しているが、リード当たりの確率の可視化はmethplotlibに特有の機能である。(以下略)


インストール

Github

#bioconda(link)
conda create -n methplotlib -y
conda activate methplotlib
conda install -c bioconda -y methplotlib

#pip
pip install methplotlib

methplotlib -h

$ methplotlib -h

usage: methplotlib [-h] [-v] -m METHYLATION [METHYLATION ...] -n NAMES

                   [NAMES ...] -w WINDOW [-g GTF] [-b BED] [-f FASTA]

                   [--simplify] [--split] [--smooth SMOOTH]

                   [--dotsize DOTSIZE] [--example] [-o OUTFILE] [-q QCFILE]


plotting nanopolish methylation calls or frequency


optional arguments:

  -h, --help            show this help message and exit

  -v, --version         Print version and exit.

  -m METHYLATION [METHYLATION ...], --methylation METHYLATION [METHYLATION ...]

                        methylation data in nanopolish, nanocompore or ont-

                        cram format

  -n NAMES [NAMES ...], --names NAMES [NAMES ...]

                        names of datasets in --methylation

  -w WINDOW, --window WINDOW

                        window (region) to which the visualisation has to be

                        restricted

  -g GTF, --gtf GTF     add annotation based on a gtf file matching to your

                        reference genome

  -b BED, --bed BED     add annotation based on a bed file matching to your

                        reference genome

  -f FASTA, --fasta FASTA

                        required when --window is an entire chromosome, contig

                        or transcript

  --simplify            simplify annotation track to show genes rather than

                        transcripts

  --split               split, rather than overlay the methylation tracks

  --smooth SMOOTH       When plotting frequencies points are averaged using a

                        rolling window

  --dotsize DOTSIZE     Control the size of dots in the per read plots

  --example             Show example command and exit.

  -o OUTFILE, --outfile OUTFILE

                        File to write results to. Default:

                        methylation_browser_{chr}_{start}_{end}.html. Use

                        {region} as a shorthand for {chr}_{start}_{end} in the

                        filename. Missing paths will be created.

  -q QCFILE, --qcfile QCFILE

                        File to write the qc report to. Default: The path in

                        outfile prefixed with qc_, default is qc_report_methyl

                        ation_browser_{chr}_{start}_{end}.html. Use {region}

                        as a shorthand for {chr}_{start}_{end} in the

                        filename. Missing paths will be created.


テストラン

git clone https://github.com/wdecoster/methplotlib.git
cd /methplotlib/
bash examples/test.sh


以下のコマンドが実行されている。

nanopolish(wiki)やnanocomporeの分析で得られるTSVファイルを指定する。-wで描画領域を指定する。”-n"で指定しているcalls frequenciesというのはデータセットの名前。TSVファイル2つを指定しているので2つ指定している。

methplotlib -m examples/NA19240-methylation_ACTB_calls.tsv.gz examples/NA19240-methylation_ACTB_frequency.tsv.gz \
-n calls frequencies \
-w chr7:5,525,542-5,543,028 \
-g examples/GRCh38-ACTB-locus.gtf.gz \
--simplify \
-b examples/DNase_cluster_ACTB.bed.gz
  • -m    methylation data in nanopolish, nanocompore or ont-cram format
  • -n     names of datasets in --methylation
  • -w    window (region) to which the visualisation has to be restricted
  • -g    add annotation based on a gtf file matching to your reference genome
  • -b    add annotation based on a bed file matching to your reference genome
  • --simplify   simplify annotation track to show genes rather than transcripts


methylation_browser_chr7_5525542_5543028.html

f:id:kazumaxneo:20200723224136p:plain

図は自由に拡大縮小、スクロールできる。


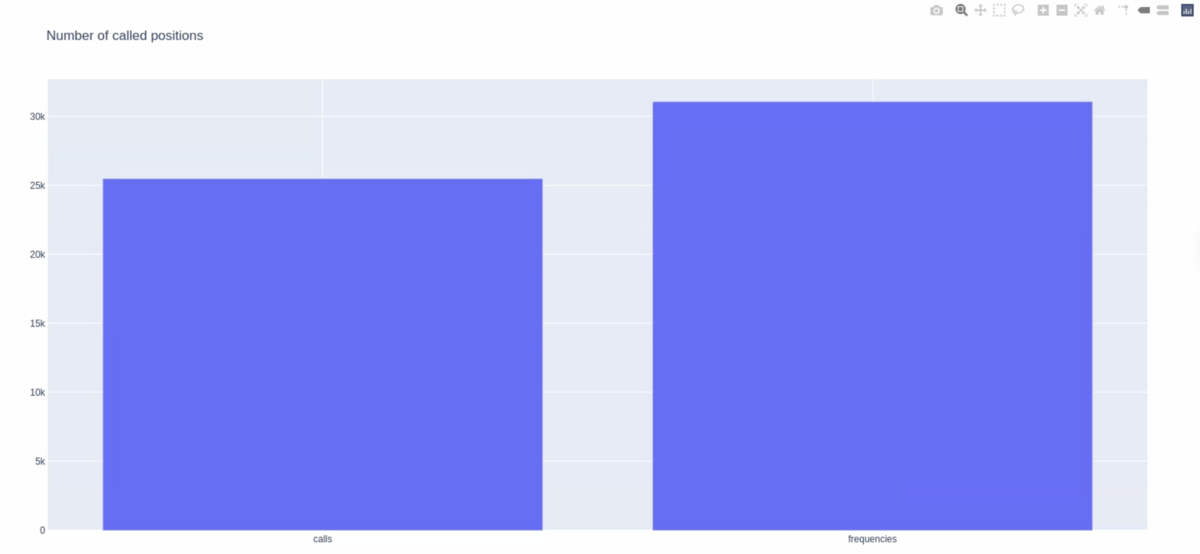
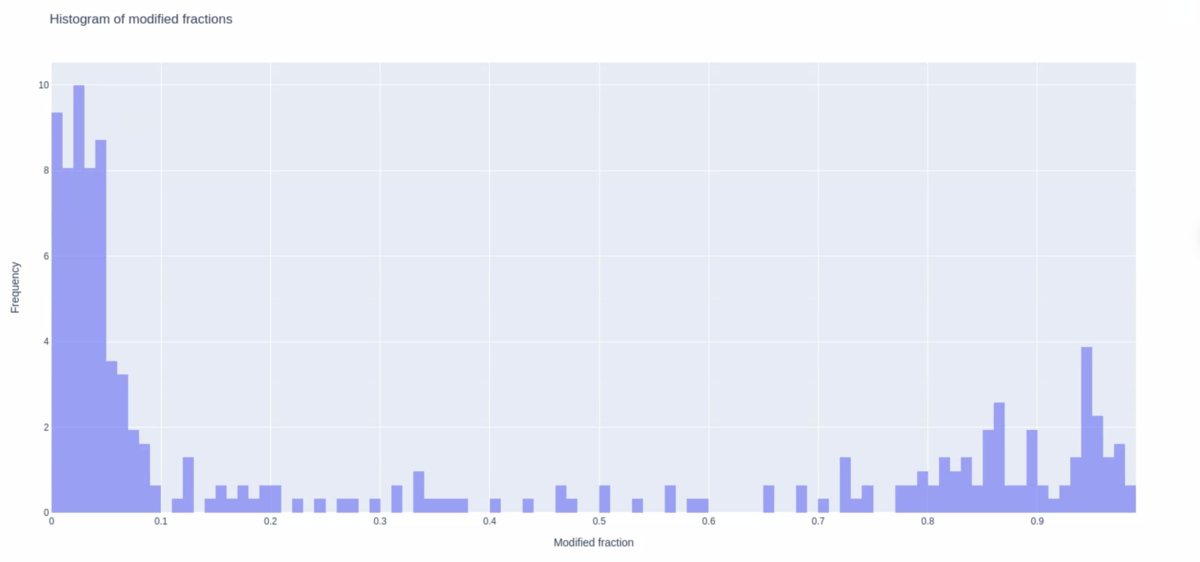
qc_report_chr7_5525542_5543028.html

f:id:kazumaxneo:20200723224247p:plain

f:id:kazumaxneo:20200723224251p:plain


実行手順

Basecallとnanopolishによるメチル化コールおよび視覚化の流れ。

#1 basecall - guppy 
guppy_basecaller --flowcell FLO-MIN106 --kit SQK-LSK109 \
-x cuda:0 -i fast5_dir -s output_dir -r

#(初回のみ)環境作成
conda create -n nanopolish -y
conda activate nanopolish
conda install -c bioconda nanopolish -y
conda install -c bioconda samtools minimap2 -y

#2 merge fastq
cat output_dir/*.fastq > ONT.fq

#3 nanopolish indexing (guppyやalbacoreの出力のsequencing_summary.txtも任意で指定して高速化できる)
nanopolish index -d fast5_dir/ -s output_dir/sequencing_summary.txt ONT.fq

#4 mapping to ref
minimap2 -t 20 -a -x map-ont ref.fa ONT.fq | samtools sort -@ 20 -T tmp -o mapped.bam
samtools index -@ 8 mapped.bam

#5 methylation call
nanopolish call-methylation -t 20 -r ONT.fq -b mapped.bam -g ref.fa -w "chr1:1-100000" > methylation_calls_chr1_1-100000.tsv

#6 visualization
methplotlib -m methylation_calls_chr1_1-100000.tsv \
-n calls \
-w chr1:5000-10000 \
-g ref.gtf.gz \
--simplify


引用
Methplotlib: analysis of modified nucleotides from nanopore sequencing

Wouter De Coster, Endre Bakken Stovner, Mojca Strazisar

Bioinformatics. 2020 May 1;36(10):3236-3238