macでインフォマティクス

macでインフォマティクス

HTS (NGS) 関連のインフォマティクス情報についてまとめています。

nextflowを使ったGATKのバリアントコールパイプライン

2020 5/15  snpEffのデータベース追加方法を追記, step2とlogの写真差し替え、dockerのコマンド追加、補足修正

2020 5/16 出力の写真差し替え、レポート追加

2020 10/11,10/12 インストールコマンド修正

2021 9/21 タイトル修正


ニューヨーク大 - Center for Genomics and Systems Biology (CGSB)のMohammed Khalfanさんの記事より(記事一覧

2016年に公開されたバリアントコールパイプラインの投稿の更新版を公開する。この更新版はGATKを採用しており、コンテナ化されたNextflowスクリプトとしてGitHubで公開している。

 次世代シーケンシングデータから、一塩基多型(SNP)やDNAの挿入・欠失(indel)を含むゲノムのバリアントを特定することは、科学的発見の重要な部分である。ニューヨーク大学ゲノム・システム生物学センター(CGSB)では、この作業が多くの研究プログラムの中心となっている。例えば、カールトン研究室では、SNPデータを解析してマラリア寄生虫Plasmodium falciparumPlasmodium vivaxの集団遺伝学を研究している。グレシャム研究室ではSNPとindelデータを用いて酵母の適応進化を研究し、化学科のルポリ研究室ではバリアント解析を用いて大腸菌抗生物質耐性を研究している。

 この研究を促進するために、研究者が正確かつ迅速にシーケンスバリアントを同定し、アノテーションを行うことができるバイオインフォマティクスパイプラインが開発された。このパイプラインは、Genome Analysis Toolkit 4(GATK4)を使用してバリアントコールを行う。これはBroad Instituteによって概説されたバリアント発見解析のベストプラクティスに基づいている。SNPが同定されると、SnpEffを使用してアノテーションを行い、バリアント効果を予測する。

 このパイプラインは、クローン性のサンプル、すなわち単一の個人のサンプルのバリアントをコールすることを目的としている。 これらのサンプルにおけるバリアントの頻度は、1(ハプロイドまたはホモ接合体二倍体の場合)または0.5(ヘテロ接合体二倍体の場合)であると予想される。 ヒト腫瘍や混合微生物集団など、対立遺伝子頻度が0から1の間で連続的に変化するような不均一なサンプルのバリアントをコールするには、研究者はサブクローナルイベントを同定するために設計されたGATK4 Mutect2を使用する必要がある(ワークフローは近日中に公開予定)。

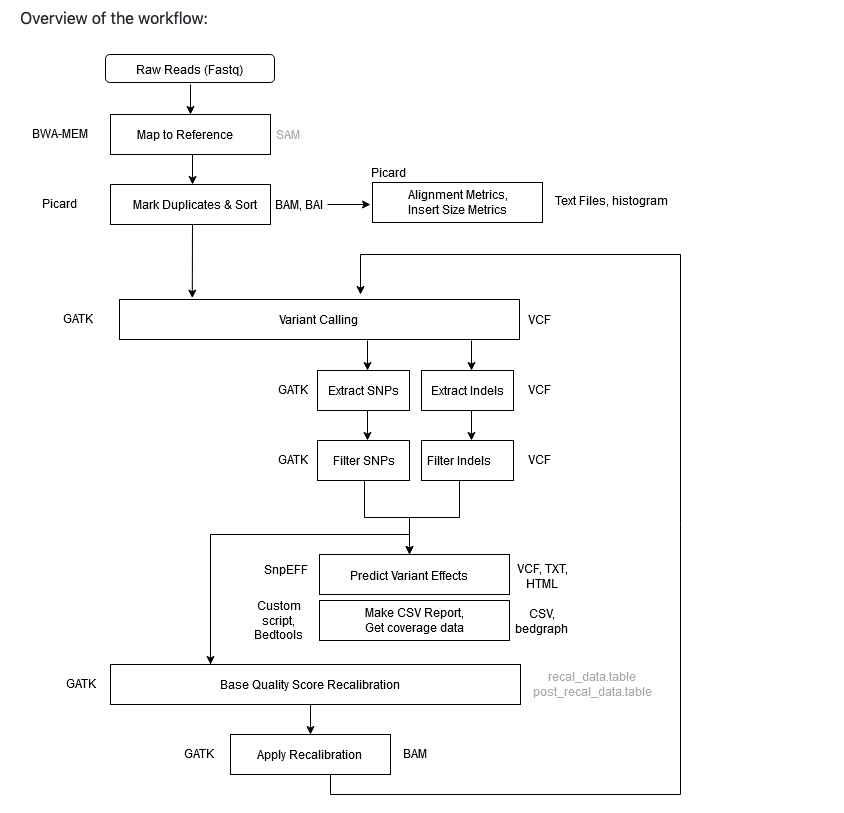
 Base Quality Score Recalibration (BQSR)は、ベースクオリティスコア(Phredスコアとして測定)に対するテクニカルなばらつきの影響を最小化することを目的とした、正確なバリアント検出のための重要なステップである。オリジナルのパイプライン(リンク)と同様に、このパイプラインでは「ゴールドスタンダード」と呼ばれる SNPS とindelのセットが BQSR のために利用できないことを前提としている。 ゴールドスタンダードがない場合、パイプラインは BQSR を実行せずにバリアントを検出する最初のステップを実行し、識別された SNP を BQSR の入力として使用してから再びバリアントをコールする。このプロセスはブートストラップと呼ばれ、ゴールドスタンダードが利用できない場合のバリアント発見解析のためのBroad Instituteのベストプラクティスで推奨されている手順である。


下のフローチャート図のようなパイプラインとなる。パイプラインの内容自体は以前紹介したv3から変化していない。

f:id:kazumaxneo:20200515101407p:plain

githubより転載


インストール

docker imageをビルドしてmac mini2018でテストした。

本体 Github

git clone https://github.com/gencorefacility/variant-calling-pipeline-gatk4.git
cd variant-calling-pipeline-gatk4/
#docker imageのビルド
docker build ./ -t cgsbgatk4

一番下に補足として説明を追加した。


実行方法

1、bwaのindex、fasta.fai、fasta.dictファイルをリファレンスのFASTAファイルと同じパスに用意しておく。

# #genome index
samtools faidx ref.fa
#ref.dict
picard CreateSequenceDictionary R=ref.fa O=ref.dict
#bwa index
bwa index -a is ref.fa

#snpeff database
#arabidopsis thalianaの場合
#利用可能なデータベースをサーチ
java -jar /data/snpEff_latest_core/snpEff/snpEff.jar databases | grep -i Arabidopsis|cut -f 1
#追加する
java -jar /data/snpEff_latest_core/snpEff/snpEff.jar download \
-v Arabidopsis_thaliana \
-c /data/snpEff_latest_core/snpEff/snpEff.config
  •  -a <STR>   BWT construction algorithm: bwtsw, is or rb2 [auto]


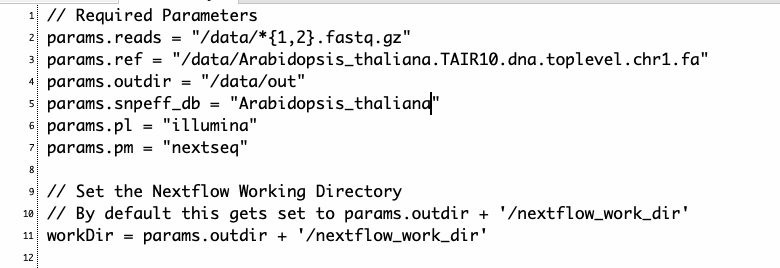
2、nextflow.configを書き換える。/dataで作業するとして以下のように直した。
f:id:kazumaxneo:20200515143449p:plain

fastqは/data/fastqに、レファレンス配列とindexは/data/reference/に置く。


3、run

#1 main.nfとスクリプトを作業ディレクトリにコピー。
cp variant-calling-pipeline-gatk4/main.nf .
cp variant-calling-pipeline-gatk4/bin/* .
#nextflow.configもコピーしておく

#2作業ディレクトリでdockerを立ち上げる
docker run -itv $PWD:/data/ -w /data cgsbgatk4
cp calling-pipeline-gatk4/bin/* /usr/local/bin/

#3 run
nextflow run main.nf -c nextflow.config

#3 run and export the report
nextflow run main.nf -with-report

#resume from previous run
nextflow run main.nf -resume

#configファイルを使わずラン時にパラメータを全指定する。
nextflow run main.nf \
--reads "/path/to/reads/*_n0{1,2}_*.fastq.gz" \
--ref "/path/to/ref.fa" \
--outdir "/scratch/user/gatk4/" \
--snpeff_db "athalianaTair10" \
--pl "illumina" \
--pm "illumina"

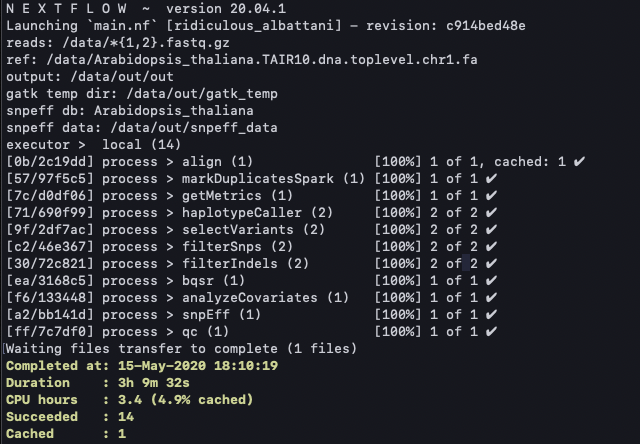
進捗が表示される。
f:id:kazumaxneo:20200516123140p:plain

無事完了した。1度目はsnpEffのランに失敗したが、フルパス指定に変更することでエラー回避した(補足参照)。


出力

f:id:kazumaxneo:20200516141554p:plain


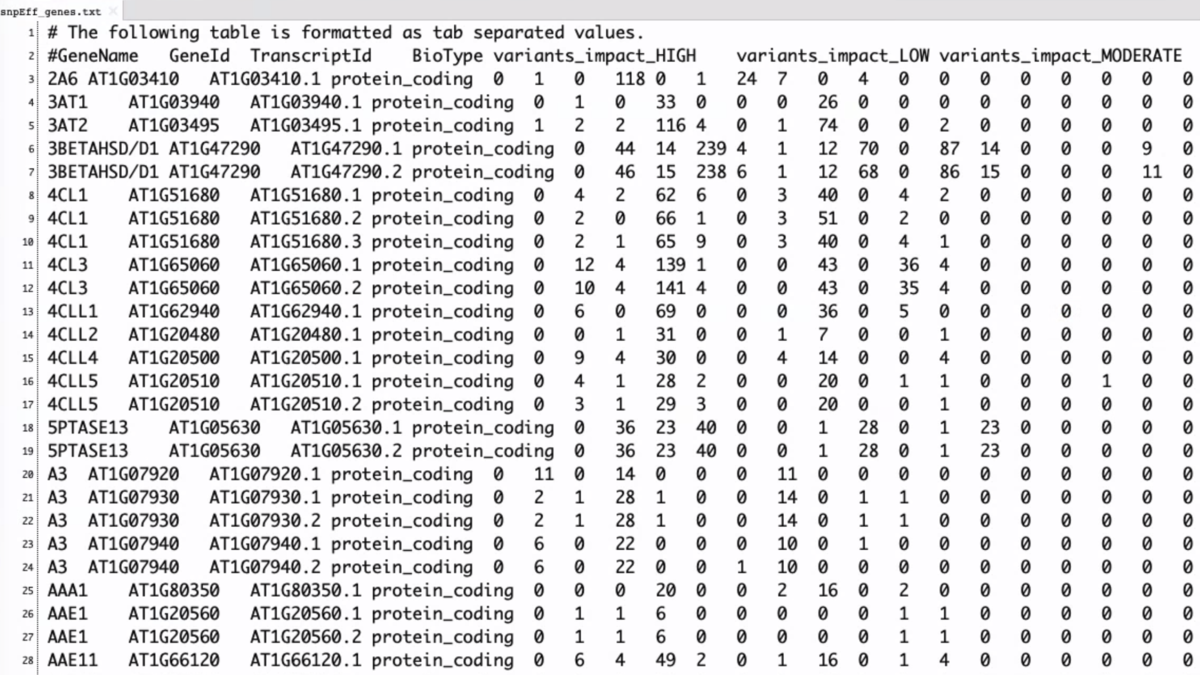
snpEff_genes.txt

f:id:kazumaxneo:20200516113809p:plain


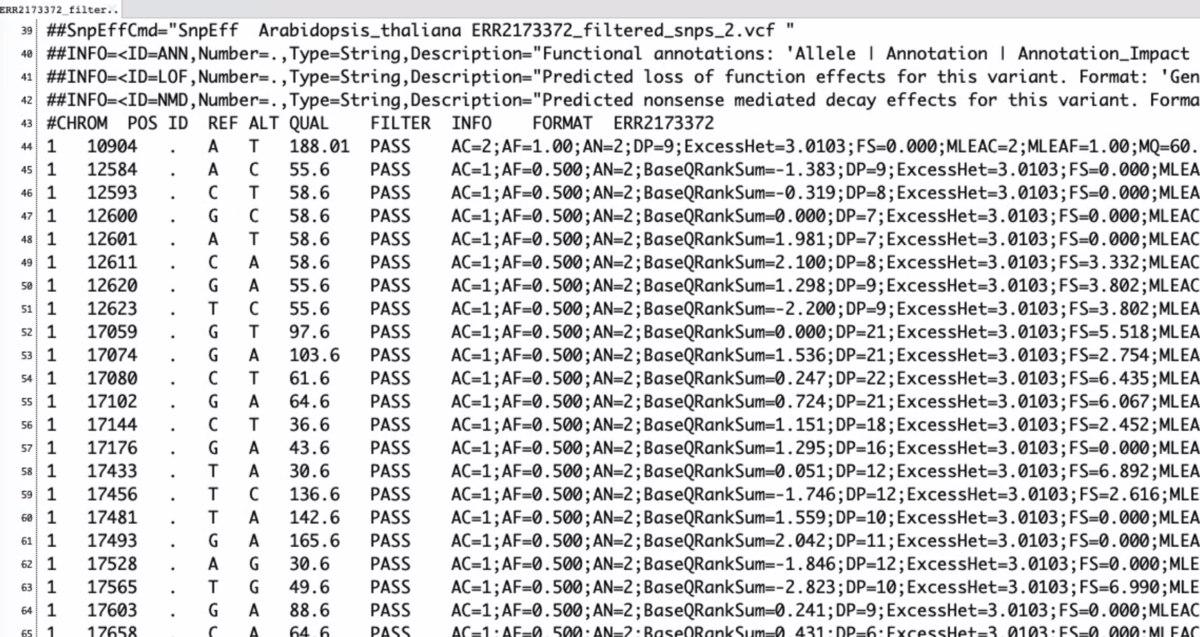
ERR2173372_filtered_snps.ann.vcf

f:id:kazumaxneo:20200516113900p:plain


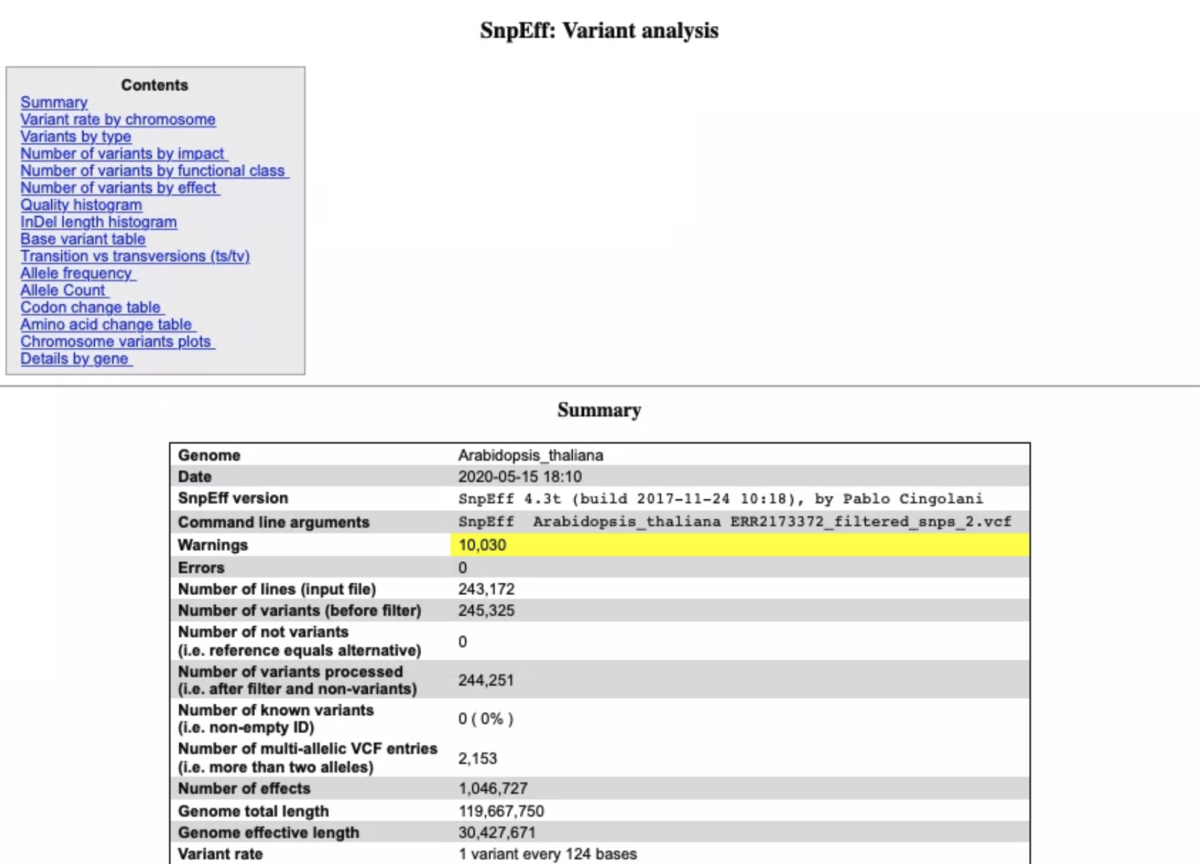
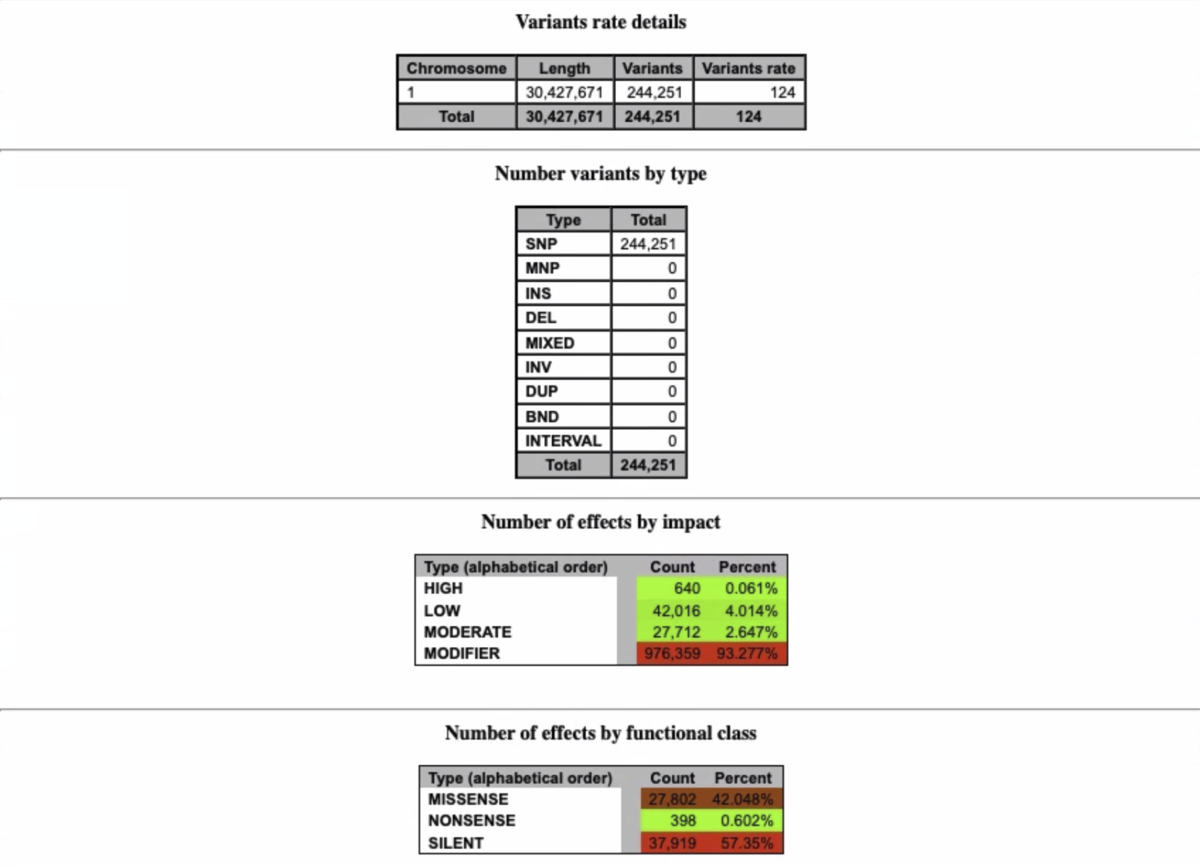
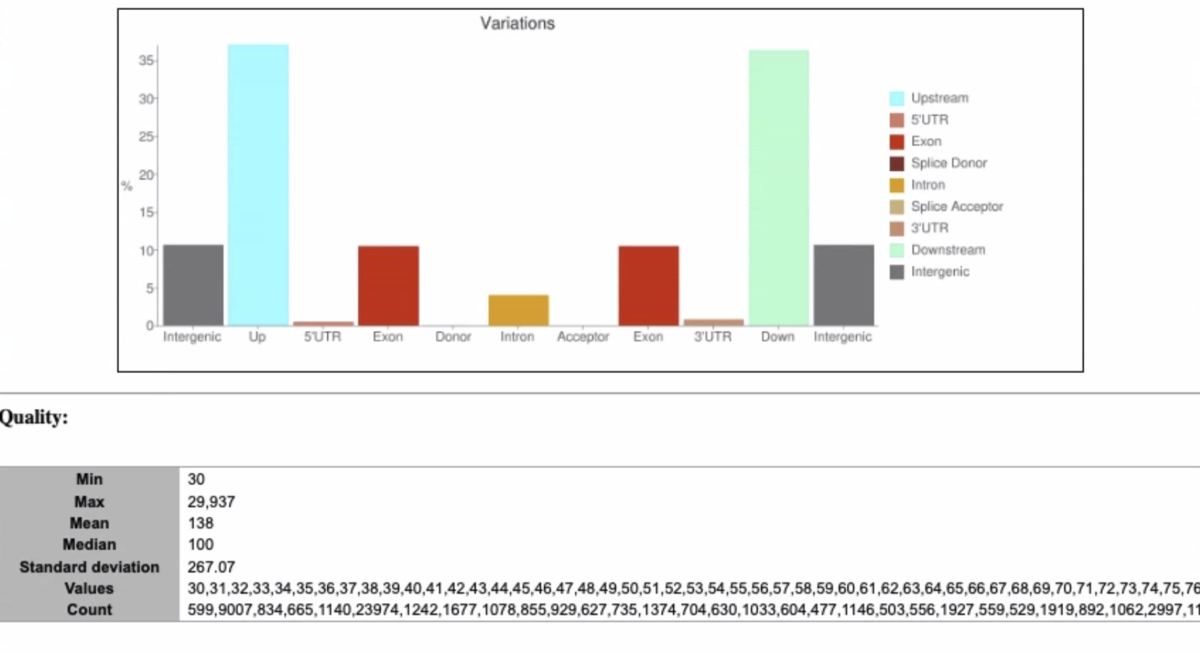
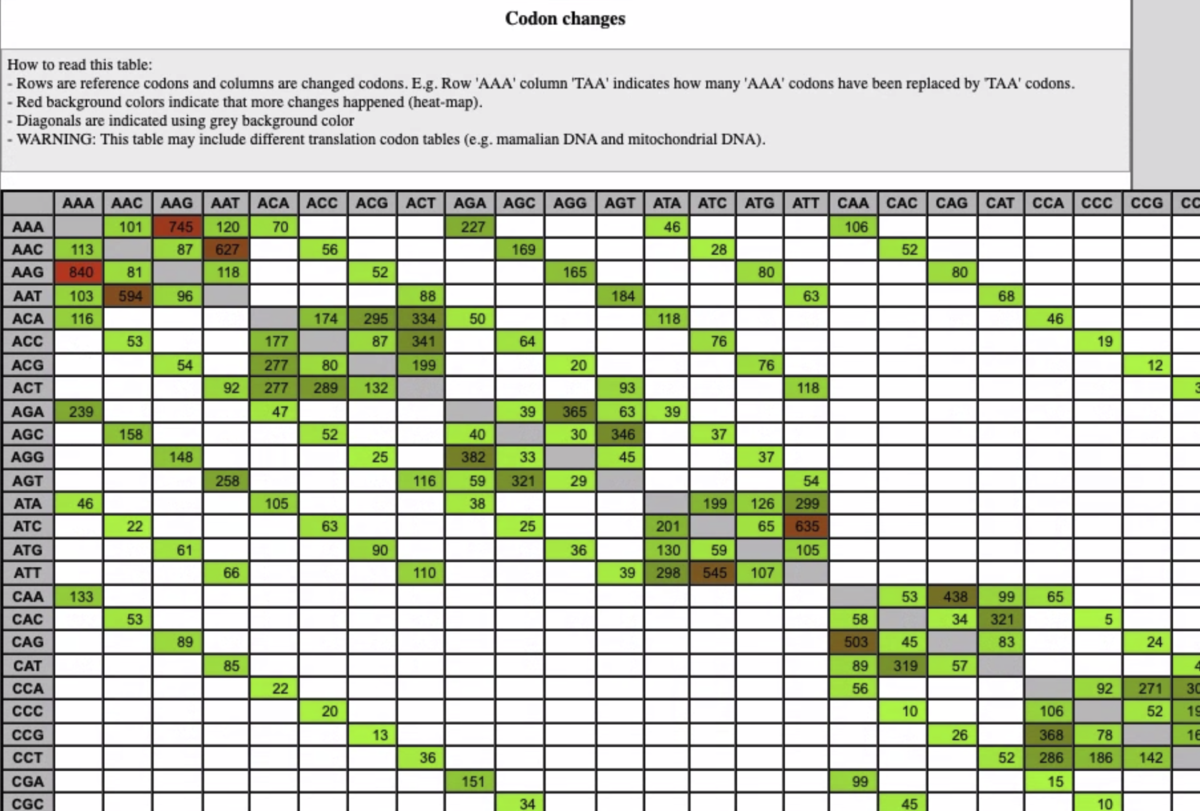
snpEffのサマリーレポート(いくつか端折ってます)

f:id:kazumaxneo:20200516112152p:plain

f:id:kazumaxneo:20200516112155p:plain

f:id:kazumaxneo:20200516112207p:plain

f:id:kazumaxneo:20200516112211p:plain

f:id:kazumaxneo:20200516112220p:plain

f:id:kazumaxneo:20200516112239p:plain

f:id:kazumaxneo:20200516112242p:plain

f:id:kazumaxneo:20200516112254p:plain


gatk3.8やgatk4についてベンチマークしたペーパーも出ています。

https://bmcbioinformatics.biomedcentral.com/articles/10.1186/s12859-019-3169-7

チャンクに分割して、複数ノードで並列計算する。

https://bmcbioinformatics.biomedcentral.com/track/pdf/10.1186/s12859-019-3169-7

GPUを使う。

ホタペンさん教えていただきありがとうございます。

引用

Variant Calling Pipeline using GATK4 – Genomics Core at NYU CGSB


参考

Changing workflows around calling SNPs and indels

https://github.com/broadinstitute/gatk-docs/blob/master/blog-2012-to-2019/2016-06-21-Changing_workflows_around_calling_SNPs_and_indels.md?id=7847


関連


補足

エラーが出たので以下のように対処しました。動作を保証するものではありませんが、参考までに残しておきます。

1、dockerfileで導入されたjavaを消す。

yum remove java -y

さらに

which java

= > 表示されるjavaを消す。 

不要


2、condaを使ってnextflowを導入すると依存しているjavaも導入されるが、これのせいで話がややこしくなる。nextflowはcondaを使わず導入する(link)。

wget -qO- https://get.nextflow.io | bash
cp nextflow /usr/local/bin/


3、javaのJDSK1.8 のrpmをダウンロードしてインストールする。複数あるが古いものを選んだ。ダウンロードにはログインが必要

https://www.oracle.com/java/technologies/javase/javase8-archive-downloads.html

# ダウンロードしたパッケージをインストール
rpm -ivh jdk-8-linux-x64.rpm
rpm -ivh jre-8u11-linux-x64.rpm

#check
java
java -version

 #間違えた時にアンインストールするなら

rpm -e jre


4、作業ディレクトリにsnpEff_latest_core/をダウンロードし、(すでに導入されているはず)

main.nfの352行目のsnpEff変数指定を、snpEff のバイナリ(実行ファイル)であるsnpEff.jar .jarのフルパスに変更。

java -jar /apps/snpeff/4_3i/snpEff.jar -v \


5、そのほか、気に入らないパラメータがあればmain.nfの該当部分を直接書き換えも良い。ここではbwaのスレッドを増やすため、main.nf52行目を

-t 12 \

に書き換えた。


6、小さなデータ、または小さな染色体1つでテストランして動作確認する。
全ゲノムプロットをインタラクティブに作成するShinyアプケーション shinyChromosome

2020 5/14 フィーチャー => 観測値に変更 


 全ゲノムの非環状プロットは、全染色体に沿って配列されたゲノムデータを自然に表現したものである。現在のところ、非環状の全ゲノム図を作成するために設計された専用のグラフィカル・ユーザー・インターフェース(GUI)は存在せず、既存のツールを使用するにはユーザーのコーディング作業が必要となる。また、このようなツールには新機能の追加などの改良が必要である。これらの課題を解決するために、非環状全ゲノム図をインタラクティブに作成するためのGUIとして、R/Shinyアプリケーション「shinyChromosome」を開発した。shinyChromosomeは、http://150.109.59.144:3838/shinyChromosome/, http://shinyChromosome.ncpgr.cn, https://yimingyu.shinyapps.io/shinyChromosome で展開されており、オンラインでの利用が可能になっている。shinyChromosomeのソースコードとマニュアルは https://github.com/venyao/shinyChromosome で自由に入手できる。


http://shinychromosome.ncpgr.cn


gallary(ファイルをダウンロードして使用することも可能)

http://shinychromosome.ncpgr.cn

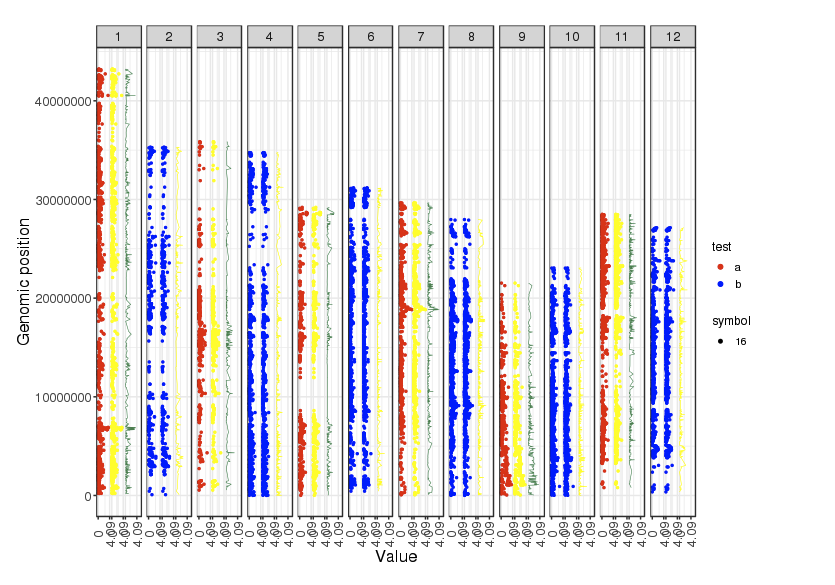
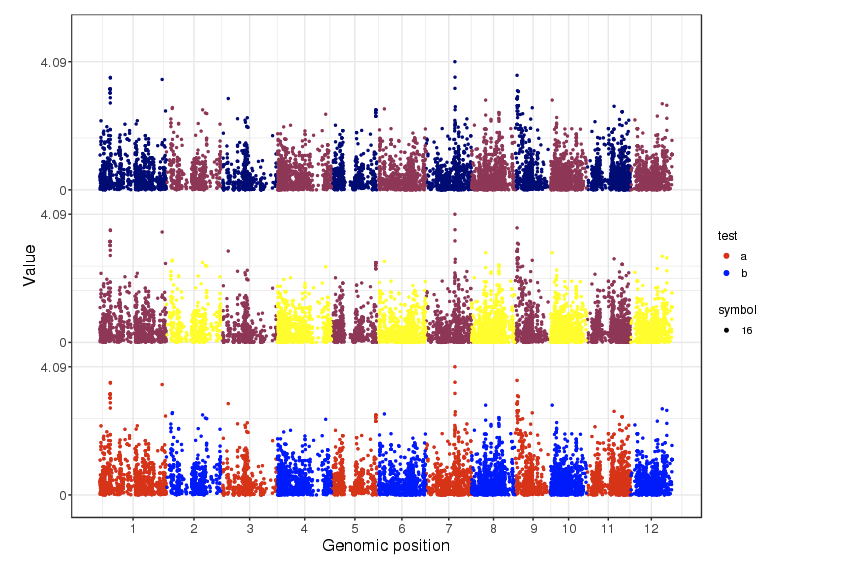
f:id:kazumaxneo:20200511230434p:plain


インストール

依存

  • R and RStudio installed (tested with R 3.5.0 and RStudio 1.1.419).

 インストール手順はhttp://shinychromosome.ncpgr.cn/#tab-1306-1 に書かれています。ローカルにインストールするなら、コンフリクトを避けるためにrockerプロジェクトのrstudio等を使って下さい(紹介)。


データの準備

視覚化するには2つのファイルが必要になる。1つ目は染色体番号とサイズを示したテキストファイルで、もう1つはグラフにプロットされる観測値の値を示したファイルになる。順番に説明する。

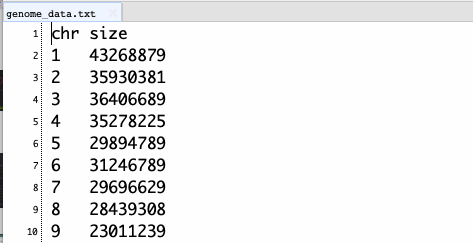
1、染色体番号と染色体のサイズを示したテキストファイル

染色体をサイズを示したファイルを準備する。1列目には染色体ID、2列目には染色体の長さが記載されていなければならない。

f:id:kazumaxneo:20200513173252p:plain

1行目はあっても無くてもよい。samtools faidxを使うと簡単に取り出せる。

samtools faidx Arabidopsis_thaliana.TAIR10.dna.toplevel.fa && \
cut -f 1-2 Arabidopsis_thaliana.TAIR10.dna.toplevel.fa.fai > genome.txt


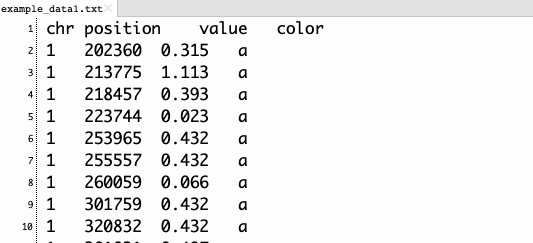
2、観測値の値を示したテキストファイル

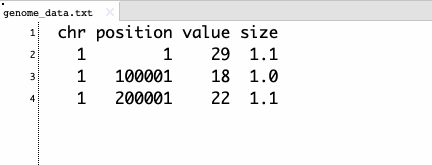
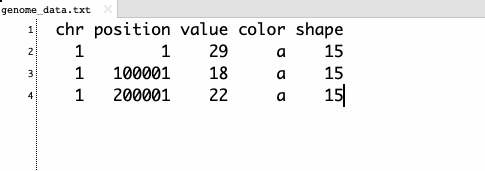
プロットしたい観測値の値を示したファイルを準備する。ラインデータ、ヒートマップデータなどを描画したい場合は、それぞれ指定のフォーマットで準備しなければならない。ここではプロットデータを例に挙げる。1列目にはフィーチャの染色体ID、2列目には観測値のポジション、3列目にはフィーチャの値が記載されていなければならない。また、任意で4列目にグループを指定する。color列の先頭行の名前は'color'でなければならない。

f:id:kazumaxneo:20200513173227p:plain


プロット図形を丸から変更するにはshapeのカラムを追加し、数値で指定する(R Plot PCH Symbols Chart)。先頭行の名前は'shape'でなければならない。

f:id:kazumaxneo:20200513184443p:plain

プロットサイズ調整にはsizeカラムを追加する。数値が大きいほどプロットサイズは小さくなる。

f:id:kazumaxneo:20200513185730p:plain

同時に複数指定する場合、4列目以降に順に記載する。

f:id:kazumaxneo:20200513185900p:plain

これらの設定はアプリ上でも変更できる。最小設定のままでも問題はない。プロット以外のファイルのフォーマットはhelpを確認して下さい。
http://shinychromosome.ncpgr.cn/

f:id:kazumaxneo:20200513195033p:plain


webサービス

interactive creation of non-circular whole genome diagram にアクセスする。

f:id:kazumaxneo:20200512005238p:plain


single genome plotとtwo genome plotに分かれている。single genome plotから見ていく。

f:id:kazumaxneo:20200513195126p:plain


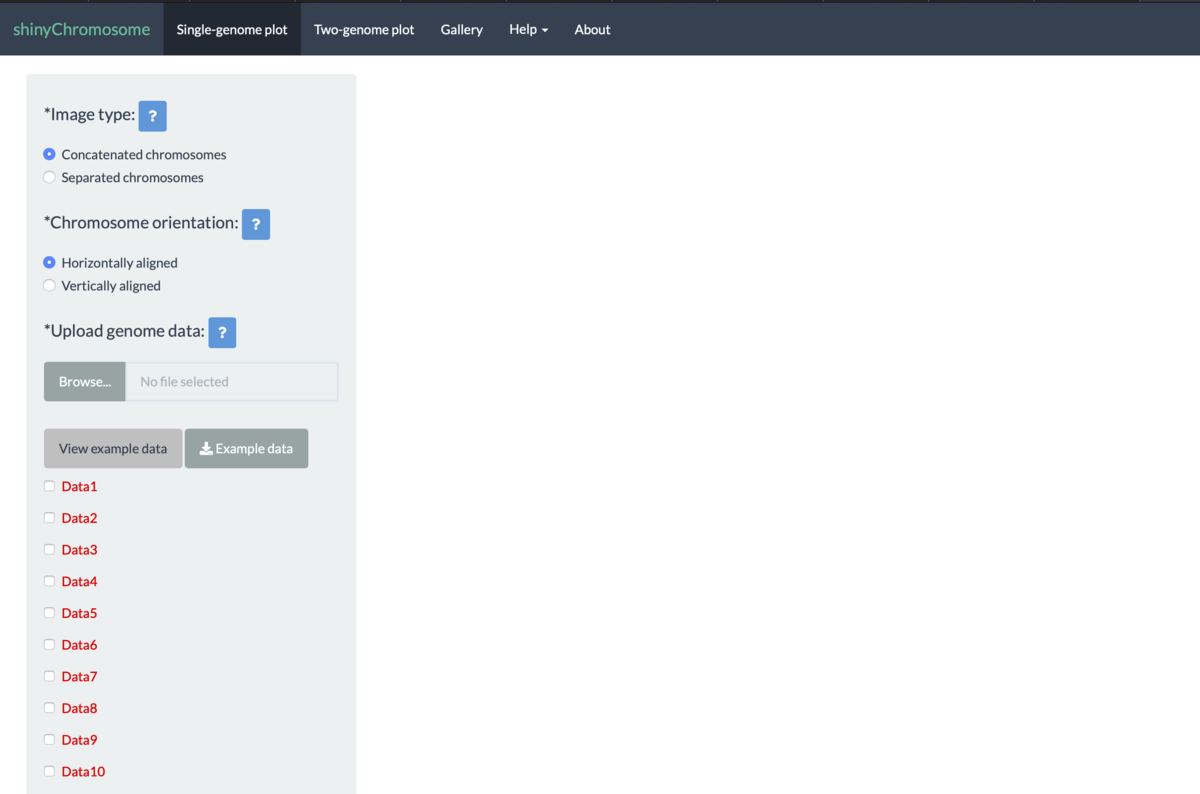
まずは染色体番号と染色体のサイズを示したテキストファイルを読み込ませる。

f:id:kazumaxneo:20200513191005p:plain


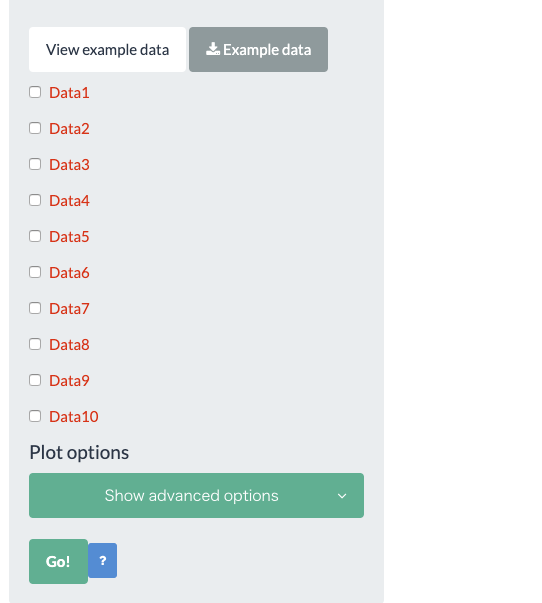
次に観測値のテキストファイルを読み込ませる。data1-10とあるのは複数の観測値を同時に指定してプロットするため。

f:id:kazumaxneo:20200513191154p:plain


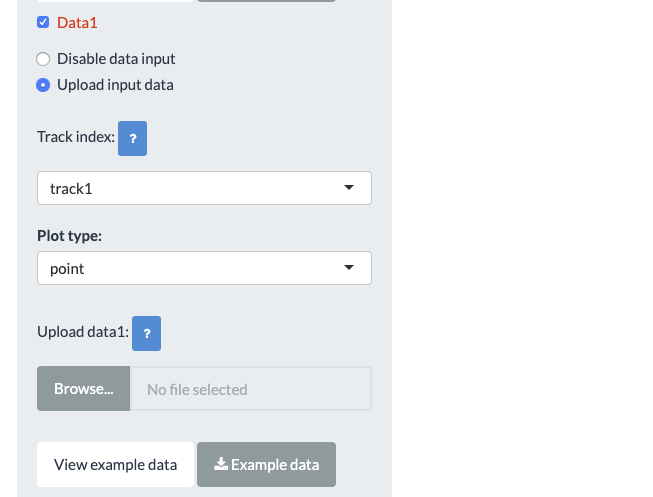
ここでは1種類の観測値のみプロットする。Data1のみ選択し、DisableからUpload input dataに切り替える。

f:id:kazumaxneo:20200513191301p:plain


切り替えた。ここではtrack1にpoint ファイルとして観測値ファイルをロードする。

f:id:kazumaxneo:20200513191352p:plain

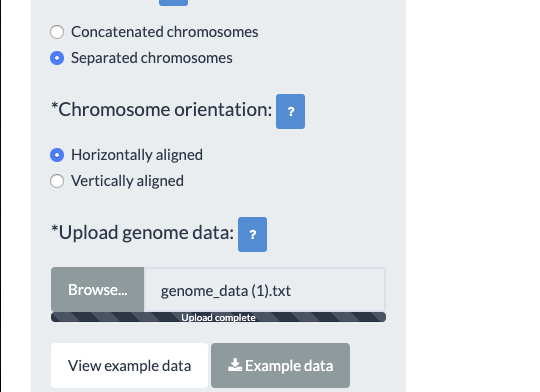
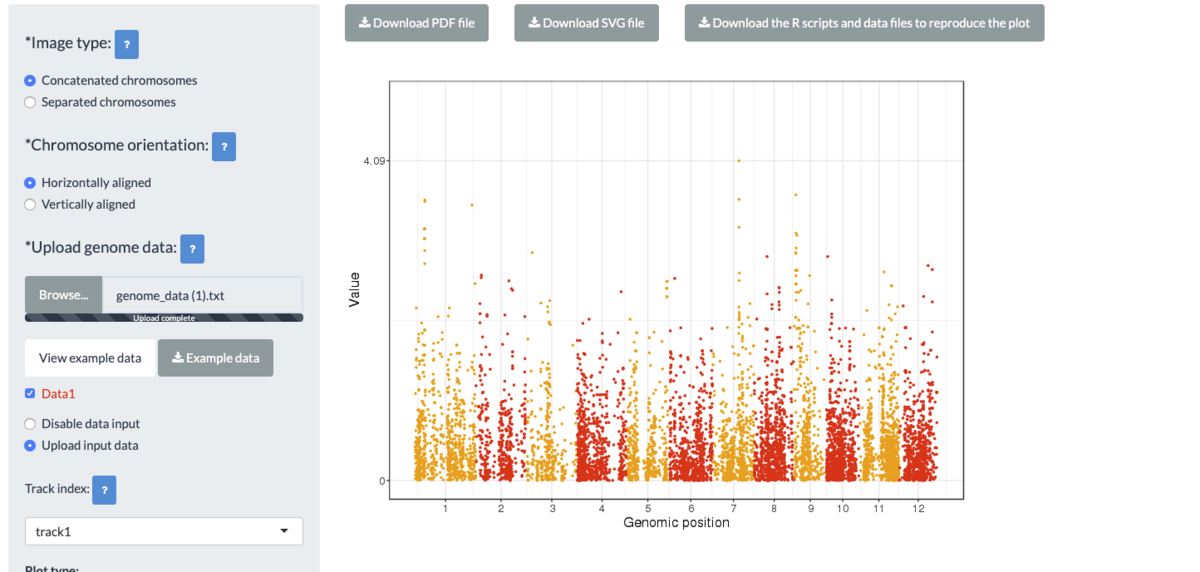
ここではExampleデータをクリックして、Exampleテキストをダウンロードした。それからBrowseボタンでロードした。 


一番下のGoボタンをクリックすると作図される。

f:id:kazumaxneo:20200513191650p:plain


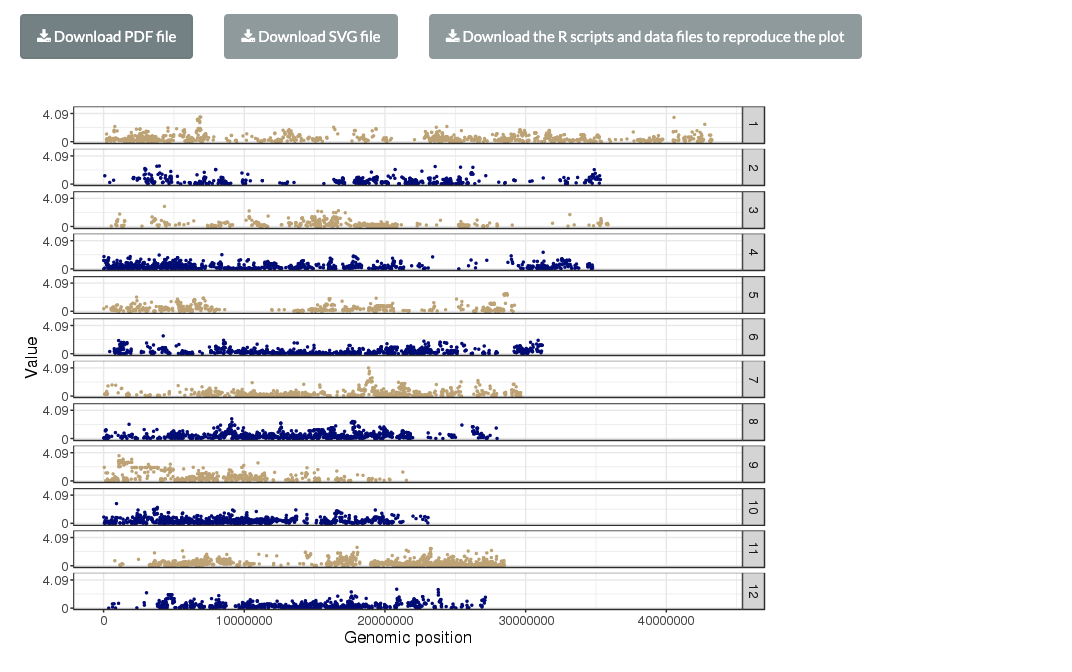
メニューの一番上のimages sizeをSeparated chromosomesに切り替えてみる。

f:id:kazumaxneo:20200513191727p:plain

GoGoボタンをクリックすると再描画される。染色体ごとに分けて作図された。

f:id:kazumaxneo:20200513191812p:plain

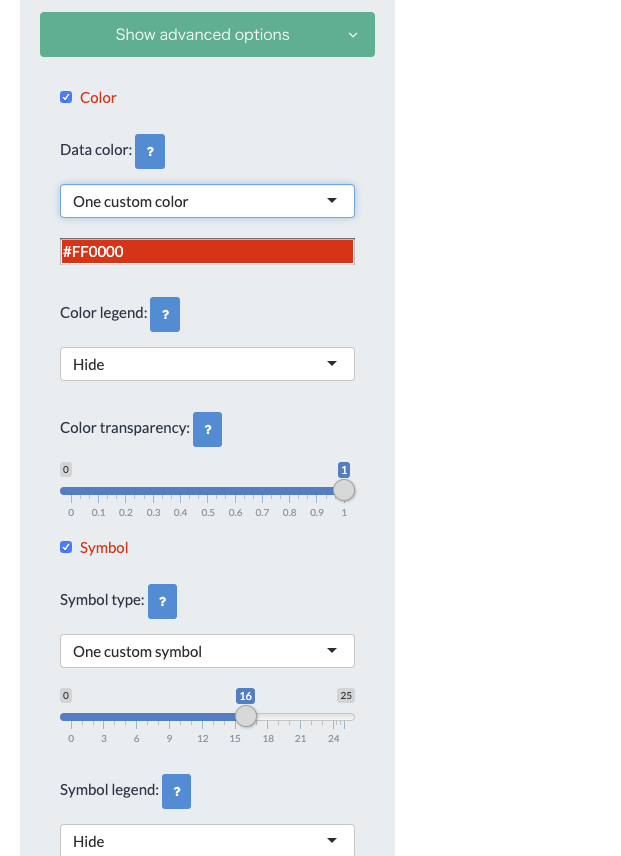
Advanced optionから プロットのパラメータを変更できる。

f:id:kazumaxneo:20200513191939p:plain

Ad

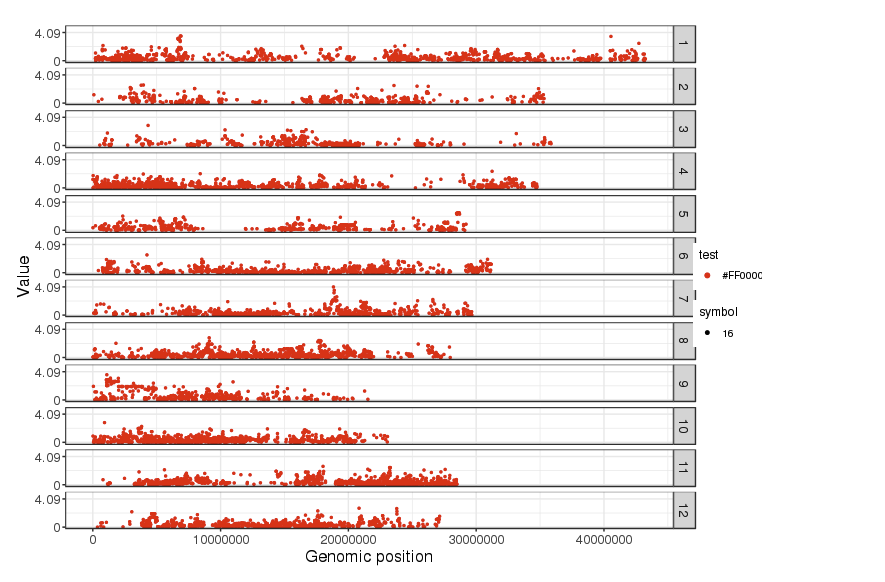
プロットの色をランダムから赤に変更し、legendも追加した。

f:id:kazumaxneo:20200513192141p:plain


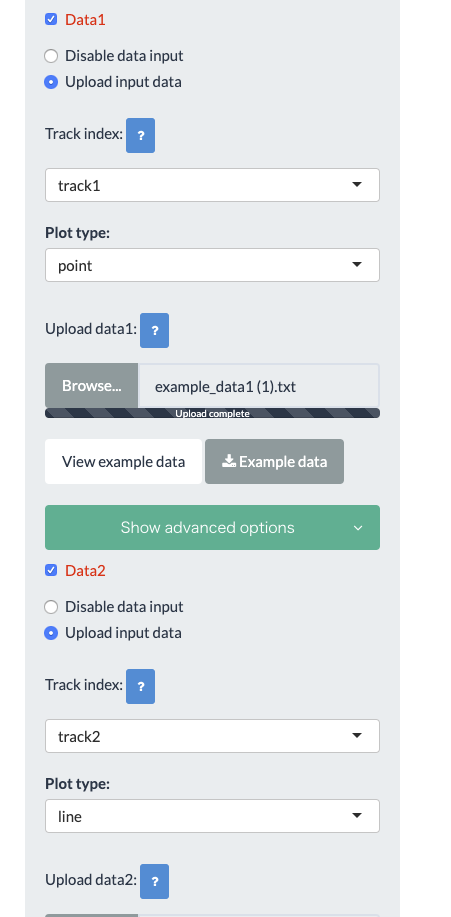
data1と2にチェックを入れて、それぞれtrack1とtrack2にした。このtrack1とか2というのはデータの順番を表す。

f:id:kazumaxneo:20200513192609p:plain

(data2はplotからlineに変更)


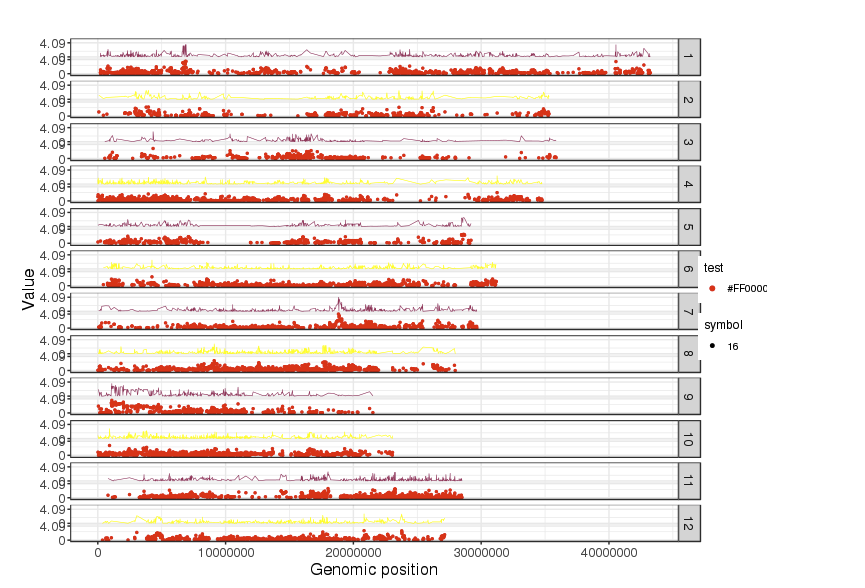
それからプロットした。指定した通りdata2は線で表現された。

f:id:kazumaxneo:20200513192312p:plain


向きを垂直にして

f:id:kazumaxneo:20200513193050p:plain

3つのデータをプロットした。data3のみlineにしている。

f:id:kazumaxneo:20200513193214p:plain


向きを元に戻し、Concatenated chromosomesスタイルで3つのデータをプロットした。

f:id:kazumaxneo:20200513193527p:plain


Vertically alignedで4つのデータをプロットした。

f:id:kazumaxneo:20200513193711p:plain


もう1つのモードはtwo genome plotになる。

2genome間で比較する。2つのゲノムそれぞれの染色体のサイズを示したテキストファイルと、フィーチャファイルの合計3ファイルが必要。

f:id:kazumaxneo:20200513184646p:plain


読み込ませる。ここではexample fileをダウンロードして指定した。

出力

f:id:kazumaxneo:20200513184621p:plain


18種類のテーマが用意されている。

theme11f:id:kazumaxneo:20200513185321p:plain
theme 18f:id:kazumaxneo:20200513185109p:plain

gallaryから好みの作図設定を探して下さい。

http://shinychromosome.ncpgr.cn

引用

shinyChromosome: An R/Shiny Application for Interactive Creation of Non-circular Plots of Whole Genomes

Yiming Yu, Wen Yao, Yuping Wang, Fangfang Huang

Genomics Proteomics Bioinformatics. 2019 Oct; 17(5): 535–539

illumina、BGIのシーケンシングリードの前処理を行う Ktrim


 次世代シーケンシング(NGS)データは、品質の悪いサイクルやアダプター汚染に悩まされることが多いため、下流での解析の前に前処理を行う必要がある。最新のシーケンサースループットとリードの長さはますます増大しており、前処理のステップは、現在のツールの性能が未充足であるため、データ解析のボトルネックになっている。そのため、シーケンシングデータの前処理のための超高速かつ高精度なアダプターやクオリティートリミングツールの開発が急務となっている。
 本研究では、Ktrimを開発した。Ktrimの主な特徴は、一般的なライブラリ調整キットのアダプターをビルトインでサポートしていること、ユーザーがカスタマイズしたアダプター配列をサポートしていること、ペアエンドとシングルエンドの両方のデータをサポートしていること、解析を高速化するための並列化をサポートしていることなどである。Ktrimは現在のツールと比較して約2〜18倍の高速化を実現し、テストデータセットに適用した場合にも高い精度を示した。このように、KtrimはショートNGSデータの前処理のための貴重で効率的なツールとして機能する可能性がある。
 この論文で記述された結果を再現するためのソースコードスクリプトは、GPL v3 ライセンスの下でhttps://github.com/hellosunking/Ktrim/にて自由に利用可能である。


インストール

ubuntu18.04でテストした。

Github

git clone https://github.com/hellosunking/Ktrim.git
cd Ktrim/
make clean
make
make install #root権限が必要。またはbin/にパスを通す。

ktrim -h

# ./ktrim -h


Usage: Ktrim [options] -1/-U Read1.fq [ -2 Read2.fq ] -o out.prefix


Author : Kun Sun (sunkun@szbl.ac.cn)

Version: 1.1.0 (Feb 2020)


Ktrim is designed to perform adapter- and quality-trimming of FASTQ files.


Compulsory parameters:


  -1/-U Read1.fq  Specify the path to the files containing read 1

                  If your data is Paired-end, use '-1' and specify read 2 files using '-2' option

                  Note that if '-U' is used, specification of '-2' is invalid

                  If you have multiple files for your sample, use ',' to separate them


  -o out.prefix   Specify the prefix of the output files

                  Note that output files include trimmed reads in FASTQ format and statistics


Optional parameters:


  -2 Read2.fq     Specify the path to the file containing read 2

                  Use this parameter if your data is generated in paired-end mode

                  If you have multiple files for your sample, use ',' to separate them

                  and make sure that all the files are well paired in '-1' and '-2' options


  -t threads      Specify how many threads should be used (default: 1, single-thread)

                  You can set '-t' to 0 to use all threads (automatically detected)


  -p phred-base   Specify the baseline of the phred score (default: 33)

  -q score        The minimum quality score to keep the cycle (default: 20)

                  Note that 20 means 1% error rate, 30 means 0.1% error rate in Phred


                  Phred 33 ('!') and Phred 64 ('@') are the most widely used scoring system

                  Quality scores start from 35 ('#') in the FASTQ files is also common


  -s size         Minimum read size to be kept after trimming (default: 36)


  -k kit          Specify the sequencing kit to use built-in adapters

                  Currently supports 'Illumina' (default), 'Nextera', 'Transposase' and 'BGI'

  -a sequence     Specify the adapter sequence in read 1

  -b sequence     Specify the adapter sequence in read 2

                  If '-a' is set while '-b' is not, I will assume that read 1 and 2 use same adapter

                  Note that '-k' option has a higher priority (when set, '-a'/'-b' will be ignored)


  -m proportion   Set the proportion of mismatches allowed during index and sequence comparison

                  Default: 0.125 (i.e., 1/8 of compared base pairs)


  -h/--help       Show this help information and quit

  -v/--version    Show the software version and quit


Please refer to README.md file for more information (e.g., setting adapters).


Ktrim: extra-fast and accurate adapter- and quality-trimmer.

bin/にパスを通しておく。


実行方法

Ktrimには、Illumina TruSeqキット、Nexteraキット、Nexteraトランスポザーゼアダプター、BGIシーケンシングキットで使用されているアダプター配列がパッケージ内に組み込まれている。ただし、'-a'(リード1)と'-b'(リード2、リード1と同じ場合は空欄にする)オプションを設定することで、アダプター配列のカスタマイズも可能。


fastqを指定する。全スレッド使用。

#paired-end
ktrim -1 pair_1.fq -2 pair_2.fq -o out.prefix -t 8

#single-end
ktrim -U single.fq -o out.prefix -t 8
  • -1    Specify the path to the files containing read 1
  • -2    Specify the path to the file containing read 2
  • -o    out.prefix Specify the prefix of the output files
  • -t     threads Specify how many threads should be used (default: 1, single-thread) You can set '-t' to 0 to use all threads (automatically detected)

ランが終わるとログと前処理されたfastqが出力される。


複数fastq。

mkdir outdir
ktrim -t 0 -p 35 -q 30 -s 36 -o outdir/out \
-1 lane1_1.fq,lane2_1.fq,lane3_1.fq
-2 lane1_2.fq,lane2_2.fq,lane3_2.fq \
-a READ1_ADAPTER_SEQUENCE -b READ2_ADAPTER_SEQUENCE
  • -p     Specify the baseline of the phred score (default: 33)

  • -q     The minimum quality score to keep the cycle (default: 20) Note that 20 means 1% error rate, 30 means 0.1% error rate in Phred.                                         Phred 33 ('!') and Phred 64 ('@') are the most widely used scoring system Quality scores start from 35 ('#') in the FASTQ files is also common
  • -s     Minimum read size to be kept after trimming (default: 36)


引用

Ktrim: an extra-fast and accurate adapter- and quality-trimmer for sequencing data
Kun Sun
Bioinformatics, btaa171, Published: 11 March 2020


関連


ショートリードアセンブリからplasmid配列を同定する Platon


 プラスミドはchromosomeから独立して複製する染色体外遺伝要素であり、細菌の環境適応において重要な役割を果たしている。プラスミドは、潜在的な移動性または接合能力により、抗菌薬耐性遺伝子や病原性因子の重要な遺伝的乗り物であり、臨床的にも大きな意味を持っている。そのため、これらは世界中の研究者の間で大規模なゲノム研究の対象となっている。次世代シークエンシングの急速に進歩の結果、シーケンシングされた細菌ゲノムの量は絶えず増加しており、その結果、(i)ドラフトアセンブリからプラスミド配列を抽出し、(ii)それらの起源と分布を導き出し、(iii)それらの遺伝的レパートリーをさらに調査するための専門的なツールの必要性が高まっている。近年、この問題に取り組むためのバイオインフォマティクス手法やツールがいくつか登場しているが、プラスミド配列の同定において、高感度と特異性を両立させることは、分類群に依存しない方法ではほとんど行われていないのが現状である。また、多くのソフトウェアツールは、大規模なハイスループット解析には適していなかったり、技術的な設計やソフトウェアの実装上、既存のソフトウェアパイプラインに組み込むことができないものが多い。本研究では、プラスミドのコンティグとchromosomeのコンティグを区別する新しいアプローチとして、タンパク質をコードする遺伝子のレプリコン分布の違いを大規模に調査した。その結果、新たな指標であるreplicon distribution score(RDS)を定義し、統計的な識別の閾値を計算したところ、96.6%の精度を達成した。最終的には、このRDS指標と、いくつかのプラスミド固有の高レベルコンティグの特徴を利用したヒューリスティックを組み合わせることで、さらに性能を向上させた。著者らは、このワークフローを、ショートリードドラフトアセンブリからのプラスミドコンティグのリクルートと特性評価のために、Platonと呼ばれる新しいハイスループットな分類群非依存型バイオインフォマティクスソフトウェアツールに実装した。PlasFlow と比較して、Platon は、幅広い細菌種でテストした結果、より高い精度 (97.5%) とよりバランスのとれた予測 (F1=82.6%) を達成し、また、大腸菌分離株のシーケンシングを目的としたツールである PlasmidFinder と PlaScope と比較して、より良いか同等の性能を達成した。Platonは次のサイトから入手可能である:platon.computational.bio


プラトンは3つの解析ステップを実施する。

1、マーカータンパク質配列(MPS)と関連するレプリコン分布スコア(RDS)からなるカスタムで事前に計算されたデータベースに対して、コード配列を予測・検索する。これらのスコアは、NCBI RefSeqの完全なレプリコン上で事前に計算されたプラスミドとchromosome間のタンパク質配列分布の経験的に測定された頻度のバイアスを表している。Platonは、各コンティグの平均RDSを計算し、RDSが95%の感度で決定された感度カットオフを下回る場合はchromosomeとして、RDSが99.9%の特異度で決定された特異度カットオフを上回る場合はプラスミドとして分類する。これらのしきい値の正確な値は、RefSeqの完全なchromosome配列とプラスミド配列から作成された人工的なレプリコン断片のモンテカルロシミュレーションに基づいて計算されている。
2、この感度フィルタを通過したコンティグは、包括的に特徴付けられる。これにより、Platonはコンティグ配列の環状化を試み、rRNA、複製、mobilizationと接合の遺伝子、oriT配列、 incompatibility group DNA probesを検索し、最後にNCBIプラスミドデータベースに対するBLAST+検索を行う。
3、最後に、全体的な感度を高めるために、Platonは収集した情報に基づいて、残りのすべてのコンティグをいくつかのヒューリスティックスによって分類する。


*MPSとRDSの定義と計算方法についてはMethodのセクションを読んでください。


HP

http://platon.computational.bio


インストール

anaconda3.7でcondaの仮想環境を作ってテストした(OSはubuntu18.04LTS)。

Github

#bioconda(link)
conda create -n platon -y
conda activate platon
conda install -c conda-forge -c bioconda -c defaults platon -y

> platon -h

$ platon -h

usage: platon [-h] [--db DB] [--mode {sensitivity,accuracy,specificity}] [--characterize] [--output OUTPUT] [--threads THREADS] [--verbose] [--version] <genome>


Identification and characterization of bacterial plasmid contigs from short-read draft assemblies.


positional arguments:

  <genome>              draft genome in fasta format


optional arguments:

  -h, --help            show this help message and exit

  --db DB, -d DB        database path (default = <platon_path>/db)

  --mode {sensitivity,accuracy,specificity}, -m {sensitivity,accuracy,specificity}

                        applied filter mode: sensitivity: RDS only (>= 95% sensitivity); specificity: RDS only (>=99.9% specificity); accuracy: RDS &

                        characterization heuristics (highest accuracy)

  --characterize, -c    deactivate filters; characterize all contigs

  --output OUTPUT, -o OUTPUT

                        output directory (default = current working directory)

  --threads THREADS, -t THREADS

                        number of threads to use (default = number of available CPUs)

  --verbose, -v         print verbose information

  --version, -V         show program's version number and exit


Citation:

Schwengers O., Barth P., Falgenhauer L., Hain T., Chakraborty T., Goesmann A. (2020)

Platon: identification and characterization of bacterial plasmid contigs in short-read draft assemblies exploiting protein-sequence-based replicon distribution scores.

bioRxiv 2020.04.21.053082; doi: https://doi.org/10.1101/2020.04.21.053082


GitHub:

https://github.com/oschwengers/platon


データベースの準備

wget https://zenodo.org/record/3751774/files/db.tar.gz
tar -xzf db.tar.gz
rm db.tar.gz


実行方法

データベースとcontig配列を指定する。

platon --db ./db contig.fasta


引用

Platon: identification and characterization of bacterial plasmid contigs in short-read draft assemblies exploiting protein-sequence-based replicon distribution scores

Oliver Schwengers, Patrick Barth, Linda Falgenhauer, Torsten Hain, Trinad Chakraborty, Alexander Goesmann

BioRxiv, Posted April 23, 2020


関連


ゲノムのマッピング可能性を調べる GenMap


 ゲノムの各位置のk-merの一意性(uniqueness)を計算することは、最大e個のミスマッチを許容しながら計算することが困難である。しかし、CRISPR実験のためのガイドRNAの設計など、多くの生物学的応用には不可欠である。より正式には、一意性または(k, e)マッピング可能性は、各位置について、このk-merがゲノム内でどのくらいの頻度で発生するかの逆数の値として記述することができる、すなわち、最大e個のミスマッチを許容する。
 本研究では、(k, e)マッピング可能性を計算するための高速な手法GenMapを提案する。このマッピングアルゴリズムを拡張し、複数のゲノムにまたがって計算できるようにした。これにより、ゲノムに固有の、あるいは全ゲノムに存在する近似的なk-merを同定することで、マーカー配列の計算やプローブデザインの候補を見つけることができる。GenMapは、各ゲノム位置の近似k-merの位置をエクスポートするためのcsvファイルだけでなく、バイナリ出力、ウィッグファイル、ベッドファイルなどの様々なフォーマットをサポートしている。
 GenMapはbioconda経由でインストールできる。バイナリとC++ソースコードhttps://github.com/cpockrandt/genmap から入手可能である。


wiki

https://github.com/cpockrandt/genmap/wiki


インストール

バイナリの配布とソースからのビルドについてはGithub参照。

#bioconda(link)
conda install -c bioconda genmap -y

genmap index -h

$ genmap index -h

GenMap index

============


SYNOPSIS


DESCRIPTION

    GenMap is a tool for fast and exact computation of genome mappability and can also be used for multiple genomes,

    e.g., to search for marker sequences.


    Detailed information is available in the wiki: <https://github.com/cpockrandt/genmap/wiki>


    Index creation. Only supports DNA and RNA (A, C, G, T/U, N). Other characters will be converted to N.


OPTIONS

    -h, --help

          Display the help message.

    --version-check BOOL

          Turn this option off to disable version update notifications of the application. One of 1, ON, TRUE, T, YES,

          0, OFF, FALSE, F, and NO. Default: 1.

    --version

          Display version information.

    --copyright

          Display long copyright information.

    -F, --fasta-file INPUT_FILE

          Path to the fasta file. Valid filetypes are: .fsa, .fna, .fastq, .fasta, .fas, and .fa.

    -FD, --fasta-directory INPUT_FILE

          Path to the directory of fasta files (indexes all .fsa .fna .fastq .fasta .fas and .fa files in there, not

          including subdirectories).

    -I, --index OUTPUT_FILE

          Path to the index.

    -A, --algorithm STRING

          Algorithm for suffix array construction (needed for the FM index). One of radix and skew. Default: skew.

    -S, --sampling INTEGER

          Sampling rate of suffix array In range [1..64]. Default: 10.

    -v, --verbose

          Outputs some additional information on the constructed index.


VERSION

    Last update: May  7 2020

    GenMap index version: 1.2.0

    SeqAn version: 2.4.1


LEGAL

    GenMap index Copyright: 2019 Christopher Pockrandt, released under the 3-clause-BSD; 2016-2019 Knut Reinert and Freie Universität Berlin, released under the 3-clause-BSD

    SeqAn Copyright: 2006-2015 Knut Reinert, FU-Berlin; released under the 3-clause BSDL.

    In your academic works please cite: Pockrandt et al (2019). GenMap: Fast and Exact Computation of Genome Mappability.

doi: https://doi.org/10.1101/611160

    For full copyright and/or warranty information see --copyright.

>genmap map -h

$ genmap map -h

GenMap map

==========


SYNOPSIS


DESCRIPTION

    GenMap is a tool for fast and exact computation of genome mappability and can also be used for multiple genomes,

    e.g., to search for marker sequences.


    Detailed information is available in the wiki: <https://github.com/cpockrandt/genmap/wiki>


    Tool for computing the mappability/frequency on nucleotide sequences. It supports multi-fasta files with DNA or

    RNA alphabets (A, C, G, T/U, N). Frequency is the absolute number of occurrences, mappability is the inverse,

    i.e., 1 / frequency-value.


OPTIONS

    -h, --help

          Display the help message.

    --version-check BOOL

          Turn this option off to disable version update notifications of the application. One of 1, ON, TRUE, T, YES,

          0, OFF, FALSE, F, and NO. Default: 1.

    --version

          Display version information.

    --copyright

          Display long copyright information.

    -I, --index INPUT_FILE

          Path to the index

    -O, --output OUTPUT_FILE

          Path to output directory (or path to filename if only a single fasta files has been indexed)

    -E, --errors INTEGER

          Number of errors

    -K, --length INTEGER

          Length of k-mers

    -S, --selection OUTPUT_FILE

          Path to a bed file (3 columns: chromosome, start, end) with selected coordinates to compute the mappability

          (e.g., exon coordinates)

    -nc, --no-reverse-complement

          Searches the k-mers *NOT* on the reverse strand.

    -ep, --exclude-pseudo

          Mappability only counts the number of fasta files that contain the k-mer, not the total number of

          occurrences (i.e., neglects so called- pseudo genes / sequences). This has no effect on the csv output.

    -fs, --frequency-small

          Stores frequencies using 8 bit per value (max. value 255) instead of the mappbility using a float per value

          (32 bit). Applies to all formats (raw, txt, wig, bedgraph).

    -fl, --frequency-large

          Stores frequencies using 16 bit per value (max. value 65535) instead of the mappbility using a float per

          value (32 bit). Applies to all formats (raw, txt, wig, bedgraph).

    -r, --raw

          Output raw files, i.e., the binary format of std::vector<T> with T = float, uint8_t or uint16_t (depending

          on whether -fs or -fl is set). For each fasta file that was indexed a separate file is created. File type is

          .map, .freq8 or .freq16.

    -t, --txt

          Output human readable text files, i.e., the mappability respectively frequency values separated by spaces

          (depending on whether -fs or -fl is set). For each fasta file that was indexed a separate txt file is

          created. WARNING: This output is significantly larger than raw files.

    -w, --wig

          Output wig files, e.g., for adding a custom feature track to genome browsers. For each fasta file that was

          indexed a separate wig file and chrom.size file is created.

    -bg, --bedgraph

          Output bedgraph files. For each fasta file that was indexed a separate bedgraph-file is created.

    -d, --csv

          Output a detailed csv file reporting the locations of each k-mer (WARNING: This will produce large files and

          makes computing the mappability significantly slower).

    -m, --memory-mapping

          Turns memory-mapping on, i.e. the index is not loaded into RAM but accessed directly from secondary-memory.

          This may increase the overall running time, but do NOT use it if the index lies on network storage.

    -T, --threads INTEGER

          Number of threads Default: 12.

    -v, --verbose

          Outputs some additional information.


VERSION

    Last update: May  7 2020

    GenMap map version: 1.2.0

    SeqAn version: 2.4.1


LEGAL

    GenMap map Copyright: 2019 Christopher Pockrandt, released under the 3-clause-BSD; 2016-2019 Knut Reinert and Freie Universität Berlin, released under the 3-clause-BSD

    SeqAn Copyright: 2006-2015 Knut Reinert, FU-Berlin; released under the 3-clause BSDL.

    In your academic works please cite: Pockrandt et al (2019). GenMap: Fast and Exact Computation of Genome Mappability.

doi: https://doi.org/10.1101/611160

    For full copyright and/or warranty information see --copyright.


実行方法

1、indexing

インデックス構築には2つのアルゴリズムがある。1つはRAM(radix)を使用し、もう1つはセカンダリメモリ(skew)を使用する。radixは比較ベースで繰り返しデータではかなり遅いので、スキューを使用することが推奨されている。複数ゲノムを使用することもできる(wiki参照)。

genmap index -F genome.fasta -I index_folder
  • -F     Path to the fasta file. Valid filetypes are: .fsa, .fna, .fastq, .fasta, .fas, and .fa.
  • -A    Algorithm for suffix array construction (needed for the FM index). One of radix and skew. Default: skew.
  • -I      Path to the index

 出力

f:id:kazumaxneo:20200511142542p:plain


2、mappability

genmap map -K 30 -E 2 -I index_folder -O out -t -w -bg
  • -K    Length of k-mers
  • -E    Number of errors
  • -I     Path to the index
  • -O    Path to output directory (or path to filename if only a single fasta files has been indexed)
  • -t     Output human readable text files, i.e., the mappability respectively frequency values separated by spaces(depending on whether -fs or -fl is set). For each fasta file that was indexed a separate txt file is created. WARNING: This output is significantly larger than raw files.
  • -w   Output wig files, e.g., for adding a custom feature track to genome browsers. For each fasta file that was indexed a separate wig file and chrom.size file is created.
  • -bg    Output bedgraph files. For each fasta file that was indexed a separate bedgraph-file is created.

出力(シングルゲノム)

f:id:kazumaxneo:20200511143751p:plain


シロイヌナズナゲノムについて調べ、IGVにwigとbedgraphを読み込んだ。ここではchr1を見ている。セントロメア領域で明らかに落ち込んでいる。

f:id:kazumaxneo:20200511143926p:plain

引用

GenMap: Ultra-fast Computation of Genome Mappability
Christopher Pockrandt, Mai Alzamel, Costas S Iliopoulos, Knut Reinert
Bioinformatics, Published: 04 April 2020


 シーケンスロゴを作成するpython API Logomaker


  シーケンスロゴは、DNA、RNA、タンパク質の配列の生物学的特性を視覚的に説得力のある方法で説明するが、Pythonプログラミング環境内でそのようなロゴを生成してカスタマイズすることは現在のところ困難である。ここでは、公開品質のシーケンスロゴを作成するためのPython APIであるLogomakerを紹介する。Logomakerは、行列のような数値の配列や複数の配列のアラインメントから、標準的なロゴと高度にカスタマイズされたロゴの両方を生成することができる。ロゴはネイティブのmatplotlibオブジェクトとしてレンダリングされ、スタイリングが簡単で、複数パネルの図に組み込むことができる。
 Logomaker は pip パッケージマネージャを使ってインストールでき、Python 2.7 と Python 3.6 の両方と互換性がある。ドキュメントは http://logomaker.readthedocs.io に、ソースコードhttp://github.com/jbkinney/logomaker にある


Document


インストール

Github

#bioconda(link)
conda create -n logomaker -y
conda activate logomaker
conda install -c bioconda logomaker -y

#pipにも対応
pip install logomaker


テストラン

jupyter notebookでテストする。

 1、ライブラリのインポート

import numpy as np
import pandas as pd
import matplotlib.pyplot as plt

#matplotlibの出力をNotebook内に描画する %matplotlib inline
#logomakerをインポート import logomaker


2、ロゴの描画

サンプルデータとしてLogomakerに含まれている大腸菌主要転写因子CRPの特異的なDNA結合能を表すロゴを作成する。このデータはサンプルデータとして含まれており、logomaker.get_example_matrixを引数'crp_energy_matrix'で呼び出すことで読み込まれる。

crp_df = -logomaker.get_example_matrix('crp_energy_matrix',
                                        print_description=False)

#スタイリングパラメータshade_below、fade_below、font_name を用いて crp_logo という名前のロゴオブジェクトを作成.(logomaker.Logo) crp_logo = logomaker.Logo(crp_df, shade_below=.5, fade_below=.5, font_name='Arial Rounded MT Bold')
出力

f:id:kazumaxneo:20200510190539p:plain

タンパク質WWドメインのマルチプルアラインメント(PFamから取得)から得られたロゴを作成する。まず、logomaker.get_example_matrixを引数'ww_information_matrix'で呼び出すことで、情報行列をww_dfにロードする。そして、ww_logoという名前のロゴオブジェクトを生成する。
ww_df = logomaker.get_example_matrix('ww_information_matrix',
                                     print_description=False)


ww_logo = logomaker.Logo(ww_df,
                         font_name='Stencil Std',
                         color_scheme='NajafabadiEtAl2017',
                         vpad=.1,
                         width=.8)
 出力

f:id:kazumaxneo:20200510191129p:plain

追加で様々なスタイリングが可能になっています。詳細はexampleとチュートリアルで確認して下さい。

引用

Logomaker: beautiful sequence logos in Python
Ammar Tareen, Justin B Kinney
Bioinformatics, Volume 36, Issue 7, 1 April 2020, Pages 2272–2274


参考


メタゲノムアセンブリのウイルスゲノム品質を評価する CheckV

2020 5/9 誤字修正

2020 12/22 論文追加


 ここ数年の間に、メタゲノミクスにより何百万もの新しいウイルス配列のアセンブルが可能になり、地球上のウイルスの多様性に関する知識が大幅に拡大した。しかし、これらの配列は小さな断片から完全なゲノムまで様々であり、その品質を推定するためのツールは現在のところ存在していない。この問題を解決するために、著者らは、ウイルスゲノムの完全性を推定し、統合されたプロウイルスに見られる非ウイルス領域の同定と除去を自動化するパイプラインであるCheckVを開発した。このアプローチを模擬データセットで検証した後、IMG/VRやGlobal Ocean Viromeを含む大規模で多様なウイルスゲノムコレクションに適用したところ、ウイルス配列の大部分は小さな断片であり、高品質(90%以上の完全性)または完全なゲノムに分類されたのはわずか3.6%であることが明らかになった。さらに、ホストの汚染を除去することで、補助代謝遺伝子の同定やウイルスがコードする機能の解釈が大幅に改善されることがわかった。CheckVは、メタゲノムからアセンブルされたウイルスゲノムを研究し、報告するすべての研究者にとって、広く役立つものと期待している。CheckVは、http://bitbucket.org/berkeleylab/CheckV において自由に利用できる。


パイプラインは主に4つのステップに分けることができる。

A: ホストの汚染除去 - CheckVは、プロウイルス上の非ウイルス領域を同定し、除去する。ず、HMMのカスタムデータベースとの比較に基づいてウイルスまたは微生物の遺伝子がアノテーションされる。次に遺伝子アノテーションGC含有量が比較される。この情報は、各遺伝子間位置でのスコアを計算し、宿主-ウイルス境界を識別するために使用される。
B: ゲノムの完全性推定 - CheckVは2段階でゲノムの完全性を推定する。まず、タンパク質を 平均アミノ酸同一性により CheckV ゲノムデータベースと比較し、コンティグ長(プロウイルスの場合はウイルス領域の長さ)と一致するリファレンスゲノムの長さの単純な比として完全性を計算し、信頼度を報告する。場合によっては、コンティグが AAI に基づく高信頼度または中信頼度の推定値を持たないことがある。このような場合、コンティグとCheckV参照ゲノムの間で共有されているHMM(ANI:平均ヌクレオチド同一性、AF:アライメントフラクション)に基づいて、精度は低いがより感度は高いアプローチが使用される。
C: closedゲノム予測 - closedゲノムは、直接末端リピート(DTR;しばしば環状配列を示す)、ウイルス-宿主境界に隣接する(完全なプロファージを示す)、または倒立末端リピート(ITR;円形化と組換えを促進すると考えられている)のいずれかに基づいて同定される。可能な限り、これらの予測は、Bで得られた推定完全性(例えば、完全性>90%)に基づいて検証される。DTRは、完全なゲノムの最も信頼性が高く、最も一般的な指標である。
D:品質の要約 - A-Cの結果に基づいて、CheckVはレポートファイルを生成し、クエリコンティグを、完全、高品質(90%以上の完全性)、中品質(50-90%の完全性)、低品質(50%未満の完全性)、または未決定の品質の5つの品質レベルのうちの1つに割り当てる。


インストール

anaconda3.7でcondaの仮想環境を作ってテストした(macではエラがー出たためubuntu18.04使用)。

Bitbucket

#bioconda(link)
conda create -n checkv -y
conda activate checkv
conda install -c conda-forge -c bioconda checkv

#pipにも対応
pip install checkv

#pipで導入した場合はBLAST+ (v2.5.0)、DIAMOND (v0.9.30)、HMMER (v3.3)、Prodigal (v2.6.3)も別途インストールすること。

checkv -h

$ checkv -h

usage: checkv [-h] [--version] {contamination,completeness,repeats,quality_summary} ...


Assess the quality of viral genomes from metagenomes & viromes.


positional arguments:

  {contamination,completeness,repeats,quality_summary}

    contamination       estimate host contamination for integrated proviruses

    completeness        estimate completeness for genome fragments

    repeats             identify terminal repeats & estimate genome copy #

    quality_summary     summarize results across modules


optional arguments:

  -h, --help            show this help message and exit

  --version             show program's version number and exit

checkv contamination -h

$ checkv contamination -h

usage: checkv contamination [-h] [-d PATH] [-t INT] [--restart] [--quiet] input output


Estimate host contamination for integrated proviruses


positional arguments:

  input       Input nucleotide sequences in FASTA format

  output      Output directory


optional arguments:

  -h, --help  show this help message and exit

  -d PATH     Reference database path. By default the CHECKVDB environment variable is used (default: None)

  -t INT      Number of threads to use for Prodigal and hmmsearch (default: 1)

  --restart   Overwrite existing intermediate files. By default CheckV continues where program left off (default: False)

  --quiet     Suppress logging messages (default: False)

checkv completeness -h

$ checkv completeness -h

usage: checkv completeness [-h] [-d PATH] [-t INT] [--restart] [--quiet] input output


Estimate completeness for genome fragments


positional arguments:

  input       Input nucleotide sequences in FASTA format

  output      Output directory


optional arguments:

  -h, --help  show this help message and exit

  -d PATH     Reference database path. By default the CHECKVDB environment variable is used (default: None)

  -t INT      Number of threads to use for Prodigal and DIAMOND (default: 1)

  --restart   Overwrite existing intermediate files. By default CheckV continues where program left off (default: False)

  --quiet     Suppress logging messages (default: False)

checkv repeats -h

$ checkv repeats -h

usage: checkv repeats [-h] [--min_tr_len INT] [--max_tr_count INT] [--max_tr_dust FLOAT] [--quiet] input output


Identify terminal repeats & estimate genome copy #


positional arguments:

  input                Input viral sequences in FASTA format

  output               Output directory


optional arguments:

  -h, --help           show this help message and exit

  --min_tr_len INT     Min length of TR (default: 20)

  --max_tr_count INT   Max occurrences of TR per contig (default: 5)

  --max_tr_dust FLOAT  Longest low complexity region per TR, as % of TR length (default: 20.0)

  --quiet              Suppress logging messages (default: False)

checkv quality_summary -h

$ checkv quality_summary -h

usage: checkv quality_summary [-h] [--quiet] input output


Summarize results across modules


positional arguments:

  input       Input viral sequences in FASTA format

  output      Output directory


optional arguments:

  -h, --help  show this help message and exit

  --quiet     Suppress logging messages (default: False)


データベースの準備

#1.8GB
wget https://portal.nersc.gov/CheckV/checkv-db-v0.6.tar.gz
tar -zxvf checkv-db-v0.6.tar.gz
export CHECKVDB=/path/to/checkv-db-v0.6

環境変数を定義せずにランする場合、"-d"でデータベースのパスを指定する。


テストラン 

cd berkeleylab-checkv-9255c64c92a1/test/


1−4の順番に進める。

1、contaminationコマンド

ホスト ゲノムにIntegrateされたプロファージに隣接するホスト領域を特定する。

checkv contamination test.fna checkv_out -t 16


2、contaminationコマンド

ゲノム(contigs set)の完全性を推定する。

checkv completeness test.fna checkv_out -t 16


3、repeatsコマンド

末端を持つ完全なゲノムの可能性がある配列を特定する。

checkv repeats test.fna checkv_out

このモジュールはゲノムコピー数も推定する。
 

4、quality_summaryコマンド

CheckVの出力を要約し、コンティグに品質レベルアサイン・分類する。

checkv quality_summary test.fna checkv_out

(2の出力が必要)

出力レポート(TSVファイル)

f:id:kazumaxneo:20200509163503p:plain


出力についてはBitbucketの解説を読んでください。

引用

CheckV: assessing the quality of metagenome-assembled viral genomes

Stephen Nayfach, Antonio Pedro Camargo, Emiley Eloe-Fadrosh, Simon Roux, Nikos Kyrpides

bioRxiv, posted May 8, 2020


2020 12/22

CheckV assesses the quality and completeness of metagenome-assembled viral genomes

Stephen Nayfach, Antonio Pedro Camargo, Frederik Schulz, Emiley Eloe-Fadrosh, Simon Roux & Nikos C. Kyrpides
Nature Biotechnology (2020)