macでインフォマティクス

macでインフォマティクス

HTS (NGS) 関連のインフォマティクス情報についてまとめています。

バリアントのコールと可視化のパイプライン MutScan


 次世代シーケンシング(NGS)は何千もの突然変異を検出することができる。しかし、一部のアプリケーションでは、これらのうちのほんのわずかなものが対象のターゲットである。 NGS技術によるがんの個人化された医療検査のようなアプリケーションでは、臨床医と遺伝カウンセラーは、通常、薬物治療可能な突然変異の検出に焦点を当てている[論文より ref.1](一部略)。これらの突然変異は、患者の無細胞腫瘍DNA(ctDNA)のディープシーケンスによって検出することができる[ref.3]。しかし、ctDNAシーケンスでコールされるバリアントの突然変異対立遺伝子頻度(MAF)は非常に低い。典型的には、MAFは通常5%以下であり、0.1%という低い値であることすらあり得る[ref.4 pubmed]。そのような低いMAFを用いた突然変異の検出の必要性は、ctDNAシーケンスデータを分析する高感度な方法の開発を推進する[ref.4]。

 NGSデータの通常の突然変異検出パイプラインは、通常、各ステップごとに異なるツールを含む。例えば、著者たちの通常の腫瘍変異コールパイプラインでは、データ前処理のためのAfter [ref.5 紹介]、マッピングのためのBWA [ref.6]、パイプアップ生成のためのSamtools [ref.7]、バリアントコールのためのVarScan2 [ref.8]など多くの補助ツールが必要である。これらのステップで使用されるさまざまなツールは、適用されるフィルタが異なるために情報が失われる可能性があり、最終的に特にMAFが低いものが誤検出される可能性がある。このタイプのデータ分析によるfalse negativesは、患者のよりよい治療の機会を逃す可能性があるため、臨床応用では許容できない。

 対照的に、高価だが効果のない治療法を導入する可能性があるため、鍵突然変異のfalse positives検出も避けるべきである。false positivesによる間違った治療法は重大な副作用を引き起こすことさえある[ref.10 pubmed]。従来のNGSパイプラインは多くの置換とINDELを検出することができるが、必然的に誤検出を引き起こす。特に、アライナーのリファレンスゲノムへの不正確なマッピングのために、ゲノムの高度に反復する領域において偽陽性突然変異が検出され得る。この誤ったコール頻度を減らすには、すべての重要な突然変異を検証する必要がある[ref.11]。バリアントの視覚化は、突然変異の信頼性を手動で確認する重要な方法である。 IGV [ref.12]やGenomeBrowseなどのツールを使用してバリアントのビジュアライゼーションを行うことができるが、これらのツールには低速で非効率なBAMファイルの操作が必要である。特に、非常にディープなシーケンスデータにおいて低いMAF変異を視覚化すると、IGVまたはGenomeBrowseは、突然変異したリードを何千ものリード中に配置することが困難になるため不便である。したがって、高速で軽量でクラウドに優しいバリアントの視覚化ツールが必要である。

 ここで紹介されているツールMutScanは、これらの問題に対処するために特別に設計されている。エラー耐性のある文字列検索アルゴリズムを基に構築されており、ローリングハッシュ[ref.13]とブルームフィルタ[14]を使用して速度を最適化している。 MutScanは、CSVファイルまたはプログラムであらかじめ定義されているターゲット変異を検出するためリファレンスフリーモードでも実行できる。 VCFファイルとそれに対応するリファレンスゲノムのFastAファイルを提供することで、MutScanはこのVCF内のすべてのバリアントをスキャンし、各バリアント用のHTMLページをレンダリングすることによって視覚化することができる。


f:id:kazumaxneo:20180513183822j:plain

MutScanのワークフロー。論文より転載。


特徴

  • Ultra sensitive, guarantee that all reads supporting the mutations will be detected
  • Can be 50X+ faster than normal pipeline (i.e. BWA + Samtools + GATK/VarScan/Mutect).
  • Very easy to use and need nothing else. No alignment, no reference genome, no variant call, no...
  • Contains built-in most actionable mutation points for cancer-related mutations, like EGFR p.L858R, BRAF p.V600E...
  • Beautiful and informative HTML report with informative pileup visualization.
  • Multi-threading support.
  • Supports both single-end and pair-end data.
  • For pair-end data, MutScan will try to merge each pair, and do quality adjustment and error correction.
  • Able to scan the mutations in a VCF file, which can be used to visualize called variants.
  • Can be used to filter false-positive mutations. i.e. MutScan can handle highly repetive sequence to avoid false INDEL calling.


想定されるシナリオ

  • you are interested in some certain mutations (like cancer drugable mutations), and want to check whether the given FastQ files contain them.
  • you have no enough confidence with the mutations called by your pipeline, so you want to visualize and validate them to avoid false positive calling.
  • you worry that your pipeline uses too strict filtering and may cause some false negative, so you want to check that in a fast way.
  • you want to visualize the called mutation and take a screenshot with its clear pipeup information.
  • you called a lot of INDEL mutations, and you worry that mainly they are false positives (especially in highly repetive region)
  • you want to validate and visualize every record in the VCF called by your pipeline.

ガン原遺伝子の探索ではbuilt-inのデータベースを使えるので、raw シーケンスデータから新規に変異解析を実行できます。それ以外のケースでは、あらかじめ別のツールで解析してvcfを得る必要があります。本ツールにvcfを入力することで、簡単なフィルタリングと結果の可視化を行えます。


GithubにSample reportが用意されている。

http://opengene.org/MutScan/report.html


インストール

mac os 10.12でテストした。

Github

GitHub - OpenGene/MutScan: Detect and visualize target mutations by scanning FastQ files directly

git clone https://github.com/OpenGene/mutscan.git
cd mutscan
make
sudo make install

mutscan

$ mutscan 

usage: mutscan --read1=string [options] ... 

options:

  -1, --read1         read1 file name (string)

  -2, --read2         read2 file name (string [=])

  -m, --mutation      mutation file name, can be a CSV format or a VCF format (string [=])

  -r, --ref           reference fasta file name (only needed when mutation file is a VCF) (string [=])

  -h, --html          filename of html report, default is mutscan.html in work directory (string [=mutscan.html])

  -t, --thread        worker thread number, default is 4 (int [=4])

  -S, --support       min read support for reporting a mutation, default is 2 (int [=2])

  -k, --mark          when mutation file is a vcf file, --mark means only process the records with FILTER column is M

  -l, --legacy        use legacy mode, usually much slower but may be able to find a little more reads in certain case

  -s, --standalone    output standalone HTML report with single file. Don't use this option when scanning too many target mutations (i.e. >1000 mutations)

      --simplified    simplified mode uses less RAM but reports less information. This option can be auto/on/off, by default it's auto, which means automatically enabled when processing large FASTQ with large VCF. (string [=auto])

  -v, --verbose       enable verbose mode, more information will be output in STDERR

  -?, --help          print this message

——


ラン

テストデータのダウンロード。

http://opengene.org/dataset.html

がん原遺伝子を探索するなら、built-inのデータベースと称号するため、 ペアエンドデータを指定するだけでランできる(MutScan contains a built-in list with most actionable gene mutations for cancer diagnosis [18]. 論文より )。

mutscan -1 R1.fq.gz -2 R2.fq.gz -t 8
  • -1     read1 file name (string)  
  • -2     read2 file name (string [=])
  • -t      worker thread number, default is 4 (int [=4])

シングルエンドのシーケンスデータは"-1"で指定する。出力ファイル名を指定するなら-hフラグを立てて、"-h output.html"などと書く。

ラン結果はhtmlで出力される。

f:id:kazumaxneo:20180513175338j:plain

htmlを開く。コール部位がまとめられている。

f:id:kazumaxneo:20180513190302j:plain

1つ開いてみる。真ん中のCが変異部位。6リード変異をサポートしている。

f:id:kazumaxneo:20180513190630j:plain

書いてある通り文字の色でベースクオリティを表している。赤がlow qualityなベース。

リードをクリックするとraw sequence readが表示される。

f:id:kazumaxneo:20180513190847j:plain

 デフォルトでは最低2以上バリアントをサポートするリードがないと出力しない。フィルタリング感度を変えるには-Sフラグをつける(e.g., "-S 1")。


リダイレクトするとプレーンテキストで出力される。

mutscan -1 R1.fq.gz -2 R2.fq.gz -t 8 > result.txt

> head result.txt 

 $ head result.txt 


---------------

NRAS-neg-1-115258748-2-c.34G>T-p.G12C-COSM562 GGATTGTCAGTGCGCTTTTCCCAACACCAC A TGCTCCAACCACCACCAGTTTGTACTCAGT chr1

1, pos: 86, distance: 0, reverse

@NB551106:59:HTFV3BGX2:1:11102:9413:4074 1:N:0:AGTCAA

GGGCCTCACCTCTATGGTGGGATCATATTCATCTACAAAGTGGTTCTGGATTAGCT GGATTGTCAGTGCGCTTTTCCCAACACCAC A TGCTCCAACCACCACCAGTTTGTACTCAGT CATTTCACACCAGCAAGAACCTGTTGGAAACC

-

AAEEEAEEEEEEEEEAAEAAAEEEEEE/EEEAEEEEAEEEEEEEAEEEAEEEEEEE AEEAEEEEEEEEEEEEEEEAEEEEEEEEEE E AEEEEEEEEEEEEEEEEE/EEEEEEEEEEE EEEEEEEEEEEEEEEEEEEEEEEEEEEAAAAA

2, pos: 86, distance: 0, reverse

@NB551106:59:HTFV3BGX2:1:11102:9413:4074 1:N:0:AGTCAA


がん原遺伝子のデータベース以外を可視化するには、vcfを指定してランする。vcf指定時はリファレンスファイルも指定する必要がある(.csvならリファレンスは必要ない)。

mutscan -1 R1.fq.gz -2 R2.fq.gz -t 8 -r ref.fa -m input.vcf
  • -m      mutation file name, can be a CSV format or a VCF format
  • -r       reference fasta file name (only needed when mutation file is a VCF) (string [=])

vcfを与える場合、built-inのデータベースに依存しないため、どのような変異でも分析して可視化できる(記載はないがヒト以外でも動作する)。SVも可視化できそうだが、50~100-bp以上のSVでは横長になって視認性が悪いので、SV専用の可視化ツールの方が適していると思われる(samplotSVPV)。


引用

MutScan: fast detection and visualization of target mutations by scanning FASTQ data

Shifu Chen,Tanxiao Huang, Tiexiang Wen, Hong Li, Mingyan Xu, and Jia Gu

BMC Bioinformatics. 2018; 19: 16.


ショートリードとロングリードのハイブリッドエラーコレクションツール Jabba

 2019 7/26 追記


 生物のDNA配列の正確な決定、すなわち、DNA分子中のヌクレオチドA、C、GおよびTの正確な順序を確立することは、生物学における基本的かつ挑戦的な問題である。本質的にこのプロセスは2つのステップから成っている:(1)ケミカルプロセスによってDNAをシークエンシングし、多数のリードを生じさせ、(2)リードを処理して完全なDNA配列を再構築するゲノムアセンブリを行う。すべてのシーケンシング技術ではシーケンスにエラーが含まれ、エラープロファイルはプラットフォーム間で大きく異なる。第2世代のシーケンサーと第3世代のシーケンサーとの間には明確な区別があり、後者の方がはるかに高いエラー率ではあるが大幅に改善されたリード長を特徴とする。

 第2世代シーケンシングでは、主にイルミナのプラットフォームを検討する。イルミナの技術は、高い精度(< 2%以下のエラー率、主に置換)で短い(100-300ヌクレオチド)シーケンスを高スループットかつ低コストに生成する。 de Bruijnグラフに基づく新しいアルゴリズムは、膨大な量の第2世代シークエンシングデータのアセンブリに効率的に対処するために特別に開発された。 k-merを共有するリード間、すなわち長さkの部分文字列の間で、短いリード間の重複が線形時間内に確立される。しかしながら、de Bruijnグラフの繰り返し分解能は、第2世代データの非常に短いリード長によって著しく妨げられる。

 最近、第3世代配列決定技術(Pacific Biosciences、2013; Oxford Nano Technologies、2014)が出現し始めた。 Pacific Biosciences社のSMRTシークエンシングは、高いエラー率(論文執筆次点 最大15%、主に挿入および欠失およびより少ない程度の置換)であるにもかかわらず、はるかに長いリード(平均> 5000ヌクレオチド)をもたらす。 この高いエラー率にもかかわらず、非常に高いコンセンサス精度が達成される。なぜなら、エラーは読み取りにわたって均一に分散されるからである。 カバレッジが十分に高く、読み取り間のオーバーラップが正しく確立されている場合、この一様なエラー分布は非常に正確なコンセンサス呼び出しを可能にする。 これらの重なりを計算することは、エラー率が高いと誤ったk-mersが過剰になるため、de Bruijn graphによって効率的に達成することはできない。 したがって、第3世代のリード間のペアワイズアライメントを計算するための他の効率的な方法が開発されている[論文より ref.1,2]。

 シーケンシングリードの処理では、通常、相互に潜在的なオーバーラップを確立するためにリードをアライメントさせるか、リファレンスゲノムにマッピングする。リードのエラーは、これらのアライメントにノイズを導入し、対応するエラーのないリードよりも弱いアライメントにつながる。より低い評価のアラインメントは、その後の分析のために廃棄され、重大な情報を廃棄する可能性がある。これは、カバレッジの低い領域で低品質のリードを処理する場合に特に問題になる。このシーケンシングノイズを処理するために、エラー訂正を適用する。リードにおけるエラーを訂正することにより、最適なアライメントをより正確に同定し、より適切に定格化することができる。第2世代のリードを訂正するアルゴリズムは3つのタイプに分類されている[ref.4]。 k-merスペクトラムベースの方法[ref.5,6]は、k-merが実際のDNA配列の一部を表すかどうかを決定するためにカバレッジ閾値に依存している[ref.5,6]。サフィックスツリーベースの方法[ref.7,8]は、複数のk値を一度に処理することによってkスペクトラム法を一般化する。最後に、複数の配列アライメントベースの方法[ref.9]は、いくつかの同様のリードを整列させた後にリードを修正する。

 第3世代のリードを訂正するために、互いにリードをアライメントさせ、重複するリード間のコンセンサス配列を計算する方法を用いることができる。しかし、第3世代のリードの高精度コンセンサスに基づく補正に必要なカバレッジは、多くのシーケンシングプロジェクトにとって非常に高いファイナンシャルコストにつながる。ハイブリッドエラー訂正方法は代替手段を提供する。目標は、第2世代のリードに含まれるより正確なシーケンス情報を使用して、長い第3世代のリードを修正することである。第3世代データのカバレッジにかかわらず、(比較的安価な)第2世代のデータセットでは、長いリードを修正するのに十分であるという考えがある。これは、低カバレッジの第3世代のデータで十分かもしれないので、シーケンシングのためのファイナンシャルコストの削減をもたらす可能性がある。ハイブリッドエラー訂正方法はまた、長いリード間のペアワイズ比較を回避し、したがって二次計算の複雑さを回避するので、計算上の観点から魅力的であるように見える。第1のタイプのハイブリッドエラー訂正方法LSC [ref.10]、PacBioToCA [ref.11]およびproovread [ref.12]は、ショートリードからロングリードへのマッピングに依存し、次いで、この複数のアライメントからコンセンサス配列を呼び出す。しかしながら、そのような方法は、ショートリードを個別にマッピングし、ショートリードが生じるコンテキストを利用しない。より最近のハイブリッドエラー訂正方法であるLoRDECは、最初にショートリードからde Bruijn graphを構築し、このgraph上の長いリードをマッピングする。ロングリードが揃うgraph内の経路によって暗示されるシーケンスは、訂正されたリードを表す。 de Bruijn graphの使用には、ショートリード間のオーバーラップがロングリードにマッピングする前に確立されるという利点がある。 [ref.13]では、LoRDECが他のエラー訂正方法と同様の精度を達成したが、ランタイムが大幅に改善されていることが示された。 LoRDECは、すべてのシードがグラフのノードに対応するk-merインデックスを使用する。

 ここでは第3世代のリードのためのハイブリッドエラー訂正方法であるJabbaを紹介する。 Jabbaでは、第3世代のリードは、第2世代のリードから構築されたde Bruijn graph[ref.14]にマップされ、シード・アンド・エクステンション手法に基づく擬似的なアライメント手法を使用する。graphの結果として得られる経路は、リード訂正を指示する。シードは、個々のリードとgraphのノードとの間の最大完全一致(MEM)である。シードとしてのMEMの使用は、それらがLoRDECで使用されるので、k-mersよりもいくつかの利点を有する。第一に、シードはより長くなり得る。たとえ長いシードがまれにしか発生しないとしても、いくつかのより長いシードで、リードをどのようにしてgraphにアライメントさせるかを概算することができる。これをさらに洗練するために、より短いシードを使用することができる。第2に、拡張添字配列[ref.15]が与えられると、このインデックスを再構築する必要なしに、任意の長さのシードを探すことができる。これは、k-merインデックス(ハッシュテーブルなど)では当てはまらない。アラインメント処理中に異なる値のkを使用する必要がある場合、グラフのさまざまなk-merインデックスを構築する必要がある。最後に、MEMの使用は、de Bruijn graphを構築するためにkの任意の値を使用することを可能にする。第3世代のリードのエラー率が高いことは、シードサイズの最小値を限定する要因であるため、ハイブリッドエラー訂正技術の現状をはるかに上回る。シードサイズとk-merサイズのこのような切り離しは、より大きな値のkを使用してde Bruijn graphを構築することを可能にし、その結果、Bruijnグラフはより複雑になる。 de Bruijn graphのk-merサイズは、第2世代データのエラー率によって制限される。このようにして、graphを構築する前にショートリードを修正し、MEMをシードとして使用することで、de Bruijn graphの大きなk値が可能になり、多くの小さな繰り返しが効果的に解決される。


マニュアル

https://github.com/biointec/jabba/wiki


インストール

cent OS6でテストした。

依存

  • CMake 2.6
  • GCC 4.7

Github

git clone https://github.com/biointec/jabba.git
cd jabba/
mkdir build
cd build/
cmake ../
make -j
cd src/

./jabba 

$ ./jabba 

Jabba: Hybrid Error Correction.

Jabba v.1.0.0

Copyright 2014, 2015 Giles Miclotte (giles.miclotte@intec.ugent.be)

This is free software; see the source for copying conditions. There is NO

warranty; not even for MERCHANTABILITY or FITNESS FOR A PARTICULAR PURPOSE.


Usage: Jabba [options] [file_options] file1 [[file_options] file2]...

Corrects sequence reads in file(s)


 [options]

  -h --help display help page

  -i --info display information page

 [options arg]

  -l --length minimal seed size [default = 20]

  -k --dbgk de Bruijn graph k-mer size

  -e --essak sparseness factor of the enhance suffix array [default = 1]

  -t --threads number of threads [default = available cores]

  -p --passes maximal number of passes per read [default = 2]

  -m --outputmode short (do not extend the reads) or long (maximally extend reads) [default = short]

 [file_options file_name]

  -o --output output directory [default = Jabba_output]

  -fastq fastq input files

  -fasta fasta input files

  -g --graph graph input file [default = DBGraph.fasta]


 examples:

  ./Jabba --dbgk 31 --graph DBGraph.txt -fastq reads.fastq

  ./Jabba -o Jabba -l 20 -k 31 -p 2 -e 12 -g DBGraph.txt -fastq reads.fastq


ラン

de brujin graphは3-rdパーティのツールで作る必要がある。ここではBrownieを使う(マニュアル)。

https://github.com/biointec/brownie

sparsehashが必要になる。なければ"sudo yum install sparsehash-devel"で導入。またはここからrpmをダウンロードして"sudo rpm -ivh sparsehash-devel-1.12-3.sdl7.x86_64.rpm"を実行(2018 05実行時のバージョン)。

git clone https://github.com/biointec/brownie.git 
cd brownie/
mkdir build
cd build
cmake ..
make install

brownie -h

$ brownie -h

Usage: brownie command [options] [file_options] file1 [[file_options] file2]...

Corrects sequence reads in file(s)


 command

  readCorrection Correct input reads [default]

  graphConstruction Build de bruijn graph only

  graphCorrection Correct constructed de Bruijn graph only


 [options]

  -h --help display help page

  -i --info display information page

  -s --singlestranded enable single stranded DNA [default = false]


 [options arg]

  -k --kmersize kmer size [default = 31]

  -t --threads number of threads [default = available cores]

  -v --visits maximum number of visited nodes during bubble detection [default = 1000]

  -d --depth maximum number of visited nodes during read correction [default = 1000]

  -e --essa sparseness factor of the enhanced sparse suffix array [default = 1]

  -c --cutoff value to separate true and false nodes based on their coverage [default = calculated based on poisson mixture model]

  -p --pathtotmp path to directory to store temporary files [default = current directory]


 [file_options]

  -o --output output file name [default = inputfile.corr]

 examples:

  ./brownie readCorrection inputA.fastq

  ./brownie readCorrection -k 29 -t 4 -o outputA.fasta inputA.fasta -o outputB.fasta inputB.fastq

(anaconda2-4.2.0) [uesaka@cyano src]$ 


de brujin graph作成前にはエラー訂正もしておく必要がある。karectを使う(インストール紹介)。

karect -correct -threads=20 -matchtype=hamming -celltype=haploid -inputfile=./pair1.fastq -inputfile=./pair2.fastq -kmer=9

 brownieを使いde brujin graphを構築する。

#ペアエンドはインターレースにしておく。(seqtk
seqtk mergepe karect_pair1.fastq karect_pair2.fastq > karect_interlace.fastq

mkdir brownie_data
brownie graphCorrection -p brownie_data -k 31 karect_interlace.fastq

brownie_data/にDBGraph.fasta等が出力される。

$ head brownie_data/DBGraph.fasta 

>NODE 1 85 1 -730 1 -436

GTGTATACAGAGTAAAATTATCAGACGTCAAGCTTTTTTGTCAATTTGAATTTTGATGATAATTGCGTTGAGATTTGATACGATA

>NODE 2 61 1 -9475 1 -7634

GAGGAATGCAAATTTCAAAGAAAAGAAATGATCGTTGTACAAAGTCTGGTTTATTGCTTGA

>NODE 3 133 1 2887 1 2887

TTCAAATTCTAGTTATATATTTATACATACGATACAACGCAGCTTGGTCAAATATATCATAAGTATGAAAATATATGCAAATCCTGAACTCATGCGCGCGCAAGCGCGCGTAAATTCAAATTCTAGTTATATA

>NODE 4 61 1 8641 1 3729

AAAAAATCTTTTTGGAAACATTCCATGTTGTGATGATTCCCGCGTCGTTTTACACCAGACC

>NODE 5 32 2 4982 3452 1 -3507

AGTACAATTTATTACTTATTTAAGTAACGAGA


最後にJabbaでエラーコレクションを行う。

jabba -o Jabba -l 20 -k 31 -p 2 -e 1 -g DBGraph.fasta -fastq karect_pair1.fastq karect_pair2.fastq -fasta long_reads.fasta

ショートリード、ロングリードそれぞれについて、エラー訂正されたリードのファイルと、エラー訂正されなかったリードのファイルが出力される。


ショートリードは1度目のエラーコレクションツール(karect)とJabbaで2回エラー訂正が行われる。2018年2月のNature Communicationsにpublishされた、シロイヌナズナのゲノムのONTシーケンスの論文PCR-free paired-end readsでpolish)(https://www.ncbi.nlm.nih.gov/pmc/articles/PMC5803254/)のデータでテストしてみた。

illumina paired-end fastq: 10GBx2(ERR2173372)

f:id:kazumaxneo:20180514232013j:plain

karectの解析でユニークなk-mer  は2億から5千万まで減っている。それからjabbaでハイブリッドエラーコレクションを行うことでユニークk-merは120万まで低下している。シーケンスデータの40%ほどしかjabbaでは出力されなかったので、正規化すると差は縮まるものの、シーケンスエラー由来と考えられるユニークk-merは大きく減った。


ONT fastq : 8GB(ERR2173373)

f:id:kazumaxneo:20180515005449j:plain

ONTリードは30%ほどしかエラー訂正できなかったが、エラー訂正後は、ユニークk-merが大きく減り、raw fastqでか確認できなかった真のピークらしきk-mer頻度が出てきている。


引用

Jabba: hybrid error correction for long sequencing reads

Giles Miclotte, Mahdi Heydari, Piet Demeester, Stephane Rombauts, Yves Van de Peer, Pieter Audenaert, Jan Fostier

Algorithms Mol Biol. 2016; 11: 10


比較のプレプリントが出ています。

https://www.biorxiv.org/content/biorxiv/early/2019/05/29/519330.full.pdf


k-tuplesに基づきビニング結果を改善する d2SBin


 メタゲノミクスシーケンシングは、微生物群集の深い洞察を提供する[論文より ref.1]。メタゲノミクスデータ内の分類学的構造を調べるための重要なステップは、アセンブリされたコンティグをビン(bins)と呼ばれる別個のクラスターに割り当てることである[ref.2]。これらのビンは、種、属、またはそれ以上の分類群を表す[ref.3]。したがって、メタゲノミクス研究ではコンティグの効率的かつ正確なビニングが不可欠である。

 コンティグのビニングは、同じ種のゲノム内の、または配列間の反復配列領域、シークエンシングエラー、および菌株レベルの変動のために依然として困難である[ref.4]。多くの研究でビニングが報告されており、本質的に2つの異なる戦略[ref.5]:「Taxonomy依存型」supervised の分類と「Taxonomy非依存」unsupervised のクラスタリングに焦点を当てている。 Taxonomy依存型の研究は、配列アラインメント[ref.6]、系統発生モデル[ref.7,8]またはオリゴヌクレオチドパターン[ref.9]に基づいている。 Taxonomy非依存の研究は、配列組成[ref.10-14]、存在量[ref.15]、または配列組成および存在量の両方のハイブリッドに基づいて、コンティグから特徴を抽出してビンを推測する[ref.4,5,16-18]。したがって、これらのアプローチは、不完全または未培養ゲノムからのビンコンティグに適用することができる。 COCACOLA [ref.5]、CONCOCT [ref.4]、MaxBin2.0 [ref.18]、GroopM [ref.16]などのいくつかのハイブリッドビニングツールは、複数の関連するメタゲノムサンプルに基づいてコンティグをビンするように設計されている。同様のカバレッジプロファイルを有するコンティグは、同じゲノムから来る可能性がより高い。これまでの研究では、複数の関連するメタゲノムにわたる共変カバレッジプロファイルがコンティグビニングで重要な役割を果たすことが示されている[ref.4,5]。関連する複数のサンプルは、類似の微生物から構成されているが、存在量のレベルは異なる、所与の生態系の時間的または空間的サンプルでなければならない[ref.16]。しかしながら、多くの状況において、関連する複数のサンプルが必要な数で利用可能でない可能性があり、その結果、単一のメタゲノムに基づくコンティグビニングが依然として重要である。

 単一のサンプルに基づくContigビニングツールは、一般的に3つの戦略のうちの1つに従う。 1)配列組成。これは通常、コンティグのゲノムシグネチャとしてk = 2〜6のkタプル(k-mers)の頻度として表される。 MetaWatt [ref.12]およびSCIMM [ref.11]は、多変量統計および/または補間されたバックグラウンドゲノムのマルコフモデルを構築してコンティグをビンした。 Metacluster 3.0 [ref.14]は、kタプル頻度ベクトルとスピアマン相関を用いてコンティグをクラスター化した。 LikelyBin [ref.10]は2から5タプルに基づいてマルコフ連鎖モンテカルロ法を利用した。 2)存在量。 AbundanceBin [ref.15]は、Expectation Maximization(EM)アルゴリズムを用いた20タプルのポアソン分布に基づいて、同じ環境に存在する種の相対存在量レベルを推定した。 MBBC [ref.19]パッケージは、ポアソン過程を用いて各ゲノムの量を推定した。存在量に基づくすべてのツールは、コンティグをアセンブルするのではなく、ショートやロングのリードに対応するように設計されている。 3)組成と存在量のハイブリッド。 Maxbin1.0 [ref.17]は、単一コピーマーカー遺伝子とExpectation Maximization(EM)アルゴリズムを使用してゲノムビンを作成するために、4タプル頻度と足場カバレッジレベルを組み合わせた。 MyCC [20]は、1つまたは複数サンプルのゲノムシグネチャ、マーカー遺伝子および任意のコンティグカバレッジを組み合わせたものである。

 k-タプル組成を用いたコンティグビニングは、相対配列組成が同じゲノムの異なる領域にわたって類似しているが、異なるゲノム間では異なるという観察に基づいている[ref.21,22]。 kタプルの頻度ベクトルは、シーケンス構成の表現の1つである。一般に、現在のツールはkタプルの頻度を直接使用するが、これは相対的ではなく絶対的なシーケンス構成を表している。ここで、「絶対」頻度は、すべてのkタプルの出現回数に対するkタプルの出現回数を指す。他方、「相対的な」頻度は、kタプルの観測頻度と、所与のバックグラウンドモデルの下での対応する予想頻度との間の差を指す。同じビン内のコンティグは、1つのクラス、種または株などの同じ分類群からのものである。したがって、同じビンからのコンティグは、一貫したバックグラウンドモデルに従うことが期待される。 CVTree、d * 2、dS2などのkタプルの相対頻度に基づくいくつかの配列の相違度測定法が開発されており、最近の研究[ref.23-27]は、dS2が他の非類似性測定法相対的なkタプル頻度でしたがって、本研究では、相対的な配列組成をモデル化し、単一のメタゲノム試料についてdS2とのコンティグ間の相違度を測定しようと試みた。 dS2は、マルコフと補間マルコフ連鎖を用いてバックグラウンドゲノム[23]をモデル化することによって、2つの配列間の相違性または次世代配列決定データを測定するように設計された。以前の研究は、ゲノム間の暴露群および勾配関係[ref.24,25]、メタゲノム[ref.28]およびメタトランスクリプトーム[ref.26,27]におけるdS2の有効性を立証した。しかし、dS2を直接用いたコンティグのビニングは、計算上高価であり、大規模なメタゲノミクス研究では、シーケンスのマルコフバックグラウンドモデルを構築し、kタプルの期待カウントを計算する必要があるため実用的ではない。一方、絶対kタプル頻度に基づく多くのビニングツールおよびそのような方法の結果は妥当である。それでも、これらのツールと方法は、dS2の相違性を使用することで改善できる。したがって、本研究では、コンティグをゼロからビニングしない。代わりに、既存のビニングツールの出力に基づいてコンティグビンを調整しようとする。 k-タプル頻度ベクトルに基づいてマルコフ連鎖を用いて各コンティグをモデル化する。ビンの中心は、このビン内のすべてのコンティグの平均kタプル頻度ベクトルによって表され、マルコフ連鎖でもモデル化される。次に、dS2は、マルコフ連鎖によって表されるように、相対シーケンス構成に基づいてコンティグとビンの中心との間の相違を測定する。最後に、K平均クラスタリングアルゴリズムを適用して、dS2の非類似性に基づいてコンティグをクラスタリングする。ここで、Kはクラスタの数である。このようなアプローチは、一方で、dS2を直接使用する広範な計算複雑性の問題を克服し、他方では、初期ビニング結果をさらに改善する。この方法は、https://github.com/kunWangkun/d2SBinで入手可能なdS2Binと呼ばれるオープンソースパッケージとして開発されている。

最初に、これまで既存のツール評価に使われてきた6つの合成データセットと実際のデータセットを使用した。 5つの代表的なビニングツール: シーケンス構成(MetaCluster3.0 [ref.14]、MetaWatt [ref.12]、SCIMM [ref.11])および配列組成と存在量のハイブリッド(MaxBin1.0 [ref.17])を用いてビニング結果に調整に本手法が適用された。 MyCC [ref.20])を使用した(一部略)。dS2Binは、5つのビニングツールに適用され、6つのデータセット30回のテスト実験のうち28回でビニング結果を改善し、リコール、精度、およびARI(Adjusted Rand Index)のパフォーマンスが大幅に向上した。


インストール

cent OS6でテストした。

依存

Github

https://github.com/kunWangkun/d2SBin

git clone https://github.com/kunWangkun/d2SBin.git
cd d2SBin/
unrar x d2SBin_SourceCode.rar
cd d2SBin_SourceCode/ 

python d2SBin.py -h

$ python d2SBin.py -h

Usage: d2SBin.py [options]


Options:

  -h, --help            show this help message and exit

  -s CONTIG_FILES_LIST, --inputList_withSeq=CONTIG_FILES_LIST

                        list of contig files with sequence after Binning with

                        other tools

  -c INPUT_ORIGINAL_FILE, --contig_Seq=INPUT_ORIGINAL_FILE

                        fasta file with original sequence.

  -n BINNING_RESULT_FILELIST, --inputList_noSeq=BINNING_RESULT_FILELIST

                        list of contig files without sequence after Binning

                        with other tools

  -k K_OF_KTUPLE, --kofKTuple=K_OF_KTUPLE

                        the value k of KTuple

  -r MARKOV_MODEL_ORDER, --order=MARKOV_MODEL_ORDER

                        the order of markov model(0,1,2,3,k-2)

  -i ITERA_NUM, --iteraNum=ITERA_NUM

                        the maximum number of iteration

  -o OUTPUT_FILES, --output=OUTPUT_FILES

                        output dir

python evaluation.py 

$ python evaluation.py 

evaluation.py: error: missing required command-line argument.

Usage: evaluation.py [options]


Options:

  -h, --help            show this help message and exit

  -c RESULT_FILE, --binning_result=RESULT_FILE

                        binning result file. eg, d2SBin.k4.r0.txt (format1

                        outputfile)

  -l RESULT_LISTFILE, --binning_result_filelist=RESULT_LISTFILE

                        list of binning result files. eg,

                        MaxBin_resultListFile.txt (format2 outputfile)

  -t LABEL_FILE, --ture_label=LABEL_FILE

                        true label of contigs

  -e EVA_OUTPUT, --eva_output_dir=EVA_OUTPUT

                        the path of evaluation file


ラン

MetaClusterで分析されたテストデータをダウンロードする(メタゲノムシーケンスデータをアセンブルして、MetaCulsterでbinningして分けたFASTA)。

wget https://raw.githubusercontent.com/kunWangkun/d2SBin/master/testing_data.rar
unrar x testing_data.rar

 解凍した。MaxBinでビニングしたデータも用意されている(下はosxのFInderだがcent OSでテストしています)。

f:id:kazumaxneo:20180512111608j:plain

MetaClusterの結果のFASTAは、リストファイル。以下のようにconitgのリストとして出力されている。

$ head -n 5 testing_data/80x_output_of_MetaCluster/80x.fasta-out000.fa 

>NODE_40_length_27837_cov_74.789093

>NODE_44_length_27044_cov_75.979881

>NODE_50_length_1811_cov_75.797905

>NODE_53_length_9109_cov_75.853004

>NODE_57_length_28535_cov_75.617104


まずlsコマンドでFASTAのパスをリストアップしたファイルを作成する。

ls testing_data/80x_output_of_MetaCluster/80x.fasta-out*fa > MetaCluster_80x_input_list.txt

リストファイルを指定して、 binning結果を評価する。

python evaluation.py -l MetaCluster_80x_input_list.txt -t testing_data/80x_real_label.loc

Evalution.txt が出力される。

$ cat Evalution.txt 

contig_num    genome_num    bin_num    Recall    Precision    ARI

7721    10    10    0.8953503432197902    0.9375728532573501    0.9051298555008835uesaka-no-Air-2:d2SBin_SourceCode kazumaxneo$

 ビニングを実行する。

#出力ディレクトリの作成
mkdir d2SBin_MetaCluster_80x_output

python d2SBin.py -n MetaCluster_80x_input_list.txt -c testing_data/80x.fasta -k 6 -r 0 -i 5 -o d2SBin_MetaCluster_80x_output/

再ビニングされた。

$ ls -hl d2SBin_MetaCluster_80x_output

total 34M

-rw-r--r-- 1 uesaka user 3.1M May 12 11:25 d2SBin.k6.r0.out0.fasta

-rw-r--r-- 1 uesaka user 3.0M May 12 11:25 d2SBin.k6.r0.out1.fasta

-rw-r--r-- 1 uesaka user 4.9M May 12 11:25 d2SBin.k6.r0.out2.fasta

-rw-r--r-- 1 uesaka user 4.2M May 12 11:25 d2SBin.k6.r0.out3.fasta

-rw-r--r-- 1 uesaka user 3.3M May 12 11:25 d2SBin.k6.r0.out4.fasta

-rw-r--r-- 1 uesaka user 2.0M May 12 11:25 d2SBin.k6.r0.out5.fasta

-rw-r--r-- 1 uesaka user 7.0M May 12 11:25 d2SBin.k6.r0.out6.fasta

-rw-r--r-- 1 uesaka user 2.0M May 12 11:25 d2SBin.k6.r0.out7.fasta

-rw-r--r-- 1 uesaka user 2.0M May 12 11:25 d2SBin.k6.r0.out8.fasta

-rw-r--r-- 1 uesaka user 2.0M May 12 11:25 d2SBin.k6.r0.out9.fasta

-rw-r--r-- 1 uesaka user 288K May 12 11:25 d2SBin.out.k6.r0.txt

drwxr-xr-x 2 uesaka user 4.0K May 12 11:13 temp

Metaclusterの結果はcontigのリストファイルだが、d2SBinの出力はFASTA配列が出力されるので、Metaclusterの出力よりファイルサイズが大幅に増加している。


結果を評価する。

python evaluation.py -c d2SBin_MetaCluster_80x_output/d2SBin.out.k6.r0.txt -t testing_data/80x_real_label.loc 

$ python evaluation.py -c d2SBin_MetaCluster_80x_output/d2SBin.out.k6.r0.txt -t testing_data/80x_real_label.loc

contig_num    genome_num    bin_num    Recall    Precision    ARI

7721    10    10    0.9269524672969822    0.9660665716876052    0.9363782530967537


引用

Improving contig binning of metagenomic data using dS2 oligonucleotide frequency dissimilarity

Ying Wang, Kun Wang, Yang Young Lu, and Fengzhu Sun

BMC Bioinformatics. 2017; 18: 425.


MinHashを使い高速にゲノムを比較する MASH

2019 4/12 dockerリンク追加

2021 3/25 condaインストール追記


 BLASTが1990年に初めてpublishされたとき、公開されたアーカイブには5000万塩基以下の塩基配列しか存在しなかった[論文より ref.2]。現在では、1つのシーケンシング機器1回の実行で1兆塩基を超えるシーケンス生成が可能である[ref.3]。この規模のデータを管理し、整理する新しい方法が必要である。これに対処するために、2つのシーケンス間の近似距離を計算する一般的な問題を検討し、大きなシーケンス(またはシーケンスセット)を圧縮Sketch表現に縮小するMinHash技法[ref.4]を使用する汎用ツールキットであるMashについて説明する。数千倍も小さいSketchのみを使用することで、元のシーケンスの類似性を有界誤差で素早く推定することができる。重要なことに、この計算の誤差はSketchのサイズにのみ依存し、ゲノムサイズとは無関係である。したがって、わずか数百の値を含むSketchを使用して、任意に大きなデータセットの類似性を近似することができる。これは、大規模なゲノムデータ管理と、長らく読まれている単一分子シークエンシング技術の重要なアプリケーションである。潜在的なアプリケーションには、おおよそのグローバル距離が許容可能な問題が含まれる。種のラベルを割り当て、大きなガイドツリーを構築し、誤って追跡されたサンプルを特定し、ゲノムデータベースを検索することができる。

 MinHash技法は、ほぼ重複するWebページや画像の検出に広く使用されているローカリティセンシティブハッシング[ref.5]の一形態であるが、10年以上前の初期アプリケーションにもかかわらずゲノミクスでの使用は限られている[ref.8]。最近、MinHashはゲノムアセンブリ[ref.9]、16S rDNA遺伝子クラスタリング[ref.10]、およびメタゲノムのクラスタリング[ref.12]等の関連問題に適用されている。この確率的アプローチのメモリとCPUの要求が非常に低いため、MinHashはゲノミクスのデータ集約的な問題に適している。これを容易にするために、著者らは柔軟な構造、操作、およびゲノムデータからのMinHashスケッチの比較のためのMashを開発した。過去のMinHashのアプリケーションをベースに、データベースの検索時にチャンスマッチを区別する新しい重要性テストを導き、MinHashスケッチから2つのシーケンス間の突然変異率を推定する新しい距離メトリクスMash距離を導き出す。同様の「アライメントフリー」法は、バイオインフォマティクスで長い歴史を持っている[ref.13,14]。しかしながら、word数に基づく従来の方法は、数ヌクレオチドの短いwordに依存しており、これは密接に関連する配列を区別することができず、解釈が難しい距離測定値を生成する[ref.15-18]。あるいは、ストリングマッチングに基づく方法は、非常に正確な突然変異距離の推定値を生成することができるが、すべてのペアを比較してシーケンス全体を処理しなくてはならない[ref.19-22]。対照的に、Mash距離はサイズ縮小されたスケッチだけから迅速に計算できるが、平均ヌクレオチドアイデンティティ(ANI)[ref.23]などのアライメントベースの測定値と強く相関する結果が得られる。したがって、マッシュは、マッチングに基づくアプローチの高い特異性と統計的アプローチの次元削減とを組み合わせ、多くの大きなゲノムとメタゲノムの間の正確な全ペア比較を可能にする。

 Mashはシーケンス比較のための2つの基本的な機能を提供する:Sketchとdist。Sketch関数は、シーケンスまたはシーケンスのコレクションをMinHash Sketchに変換する(論文 図1)。 dist関数は2つのスケッチを比較し、Jaccardインデックス(すなわち共有されるk-merの割合)、P value、単純な進化モデルによる配列突然変異の割合を推定するMash distanceを返す[ref.22] 「Method」を参照)。 Mashは長さkのサブストリングまたはk-mersの比較にのみ依存するため、入力は全ゲノム、メタゲノム、ヌクレオチド配列、アミノ酸配列、または生シーケンシングの読み込みである可能性がある。各入力は、既知のアルファベットから取られたk-merの集合として単純に扱われ、多くのアプリケーションを可能にする。ここでは、3つの具体的な使用例を検討する。(1)NCBI RefSeqゲノムデータベース全体のスケッチとクラスタリング。 (2)リアルタイムでスケッチされたRefSeqデータベースに対してアセンブリされた、およびアセンブリされていないゲノムを検索すること。 (3)アセンブリされたリードセットとされていないリードセットの両方を用いてメタゲノミックサンプル間の距離を計算すること、となる。


マニュアル

http://mash.readthedocs.io/en/latest/


インストール

mac os 10.12に導入した。

本体 Github

https://github.com/marbl/mash

バイナリリリース

https://github.com/marbl/Mash/releases

#bioconda(link)
mamba install -c bioconda mash -y

> mash

$ mash


Mash version 2.3


Type 'mash --license' for license and copyright information.


Usage:


  mash <command> [options] [arguments ...]


Commands:


  bounds     Print a table of Mash error bounds.


  dist       Estimate the distance of query sequences to references.


  info       Display information about sketch files.


  paste      Create a single sketch file from multiple sketch files.


  screen     Determine whether query sequences are within a larger mixture of

             sequences.


  sketch     Create sketches (reduced representations for fast operations).


  taxscreen  Create Kraken-style taxonomic report based on mash screen.


  triangle   Estimate a lower-triangular distance matrix.

> mash sketch

$ mash sketch


Version: 2.3


Usage:


  mash sketch [options] <input> [<input>] ...


Description:


  Create a sketch file, which is a reduced representation of a sequence or set

  of sequences (based on min-hashes) that can be used for fast distance

  estimations. Inputs can be fasta or fastq files (gzipped or not), and "-" can

  be given to read from standard input. Input files can also be files of file

  names (see -l). For output, one sketch file will be generated, but it can have

  multiple sketches within it, divided by sequences or files (see -i). By

  default, the output file name will be the first input file with a '.msh'

  extension, or 'stdin.msh' if standard input is used (see -o).


Options:


  Option     Description (range) [default]


  -h         Help


  -p <int>   Parallelism. This many threads will be spawned for processing. [1]


...Input...


  -l         List input. Lines in each <input> specify paths to sequence files,

             one per line.


...Output...


  -o <path>  Output prefix (first input file used if unspecified). The suffix

             '.msh' will be appended.


...Sketching...


  -I <path>  ID field for sketch of reads (instead of first sequence ID).


  -C <path>  Comment for a sketch of reads (instead of first sequence comment).


  -k <int>   K-mer size. Hashes will be based on strings of this many

             nucleotides. Canonical nucleotides are used by default (see

             Alphabet options below). (1-32) [21]


  -s <int>   Sketch size. Each sketch will have at most this many non-redundant

             min-hashes. [1000]


  -i         Sketch individual sequences, rather than whole files, e.g. for

             multi-fastas of single-chromosome genomes or pair-wise gene

             comparisons.


  -S <int>   Seed to provide to the hash function. (0-4294967296) [42]


  -w <num>   Probability threshold for warning about low k-mer size. (0-1)

             [0.01]


  -r         Input is a read set. See Reads options below. Incompatible with -i.


...Sketching (reads)...


  -b <size>  Use a Bloom filter of this size (raw bytes or with K/M/G/T) to

             filter out unique k-mers. This is useful if exact filtering with -m

             uses too much memory. However, some unique k-mers may pass

             erroneously, and copies cannot be counted beyond 2. Implies -r.


  -m <int>   Minimum copies of each k-mer required to pass noise filter for

             reads. Implies -r. [1]


  -c <num>   Target coverage. Sketching will conclude if this coverage is

             reached before the end of the input file (estimated by average

             k-mer multiplicity). Implies -r.


  -g <size>  Genome size (raw bases or with K/M/G/T). If specified, will be used

             for p-value calculation instead of an estimated size from k-mer

             content. Implies -r.


...Sketching (alphabet)...


  -n         Preserve strand (by default, strand is ignored by using canonical

             DNA k-mers, which are alphabetical minima of forward-reverse

             pairs). Implied if an alphabet is specified with -a or -z.


  -a         Use amino acid alphabet (A-Z, except BJOUXZ). Implies -n, -k 9.


  -z <text>  Alphabet to base hashes on (case ignored by default; see -Z).

             K-mers with other characters will be ignored. Implies -n.


  -Z         Preserve case in k-mers and alphabet (case is ignored by default).

             Sequence letters whose case is not in the current alphabet will be

             skipped when sketching.


mash dist

$ mash dist


Version: 2.3


Usage:


  mash dist [options] <reference> <query> [<query>] ...


Description:


  Estimate the distance of each query sequence to the reference. Both the

  reference and queries can be fasta or fastq, gzipped or not, or Mash sketch

  files (.msh) with matching k-mer sizes. Query files can also be files of file

  names (see -l). Whole files are compared by default (see -i). The output

  fields are [reference-ID, query-ID, distance, p-value, shared-hashes].


Options:


  Option     Description (range) [default]


  -h         Help


  -p <int>   Parallelism. This many threads will be spawned for processing. [1]


...Input...


  -l         List input. Lines in each <query> specify paths to sequence files,

             one per line. The reference file is not affected.


...Output...


  -t         Table output (will not report p-values, but fields will be blank if

             they do not meet the p-value threshold).


  -v <num>   Maximum p-value to report. (0-1) [1.0]


  -d <num>   Maximum distance to report. (0-1) [1.0]


  -C         Show comment fields with reference/query names (denoted with ':').

             (0-1) [1.0]


...Sketching...


  -k <int>   K-mer size. Hashes will be based on strings of this many

             nucleotides. Canonical nucleotides are used by default (see

             Alphabet options below). (1-32) [21]


  -s <int>   Sketch size. Each sketch will have at most this many non-redundant

             min-hashes. [1000]


  -i         Sketch individual sequences, rather than whole files, e.g. for

             multi-fastas of single-chromosome genomes or pair-wise gene

             comparisons.


  -S <int>   Seed to provide to the hash function. (0-4294967296) [42]


  -w <num>   Probability threshold for warning about low k-mer size. (0-1)

             [0.01]


  -r         Input is a read set. See Reads options below. Incompatible with -i.


...Sketching (reads)...


  -b <size>  Use a Bloom filter of this size (raw bytes or with K/M/G/T) to

             filter out unique k-mers. This is useful if exact filtering with -m

             uses too much memory. However, some unique k-mers may pass

             erroneously, and copies cannot be counted beyond 2. Implies -r.


  -m <int>   Minimum copies of each k-mer required to pass noise filter for

             reads. Implies -r. [1]


  -c <num>   Target coverage. Sketching will conclude if this coverage is

             reached before the end of the input file (estimated by average

             k-mer multiplicity). Implies -r.


  -g <size>  Genome size (raw bases or with K/M/G/T). If specified, will be used

             for p-value calculation instead of an estimated size from k-mer

             content. Implies -r.


...Sketching (alphabet)...


  -n         Preserve strand (by default, strand is ignored by using canonical

             DNA k-mers, which are alphabetical minima of forward-reverse

             pairs). Implied if an alphabet is specified with -a or -z.


  -a         Use amino acid alphabet (A-Z, except BJOUXZ). Implies -n, -k 9.


  -z <text>  Alphabet to base hashes on (case ignored by default; see -Z).

             K-mers with other characters will be ignored. Implies -n.


  -Z         Preserve case in k-mers and alphabet (case is ignored by default).

             Sequence letters whose case is not in the current alphabet will be

             skipped when sketching.

mash screen

$ mash screen


Version: 2.3


Usage:


  mash screen [options] <queries>.msh <mixture> [<mixture>] ...


Description:


  Determine how well query sequences are contained within a mixture of

  sequences. The queries must be formatted as a single Mash sketch file (.msh),

  created with the `mash sketch` command. The <mixture> files can be contigs or

  reads, in fasta or fastq, gzipped or not, and "-" can be given for <mixture>

  to read from standard input. The <mixture> sequences are assumed to be

  nucleotides, and will be 6-frame translated if the <queries> are amino acids.

  The output fields are [identity, shared-hashes, median-multiplicity, p-value,

  query-ID, query-comment], where median-multiplicity is computed for shared

  hashes, based on the number of observations of those hashes within the

  mixture.


Options:


  Option    Description (range) [default]


  -h        Help


  -p <int>  Parallelism. This many threads will be spawned for processing. [1]


  -w        Winner-takes-all strategy for identity estimates. After counting

            hashes for each query, hashes that appear in multiple queries will

            be removed from all except the one with the best identity (ties

            broken by larger query), and other identities will be reduced. This

            removes output redundancy, providing a rough compositional outline.


...Output...


  -i <num>  Minimum identity to report. Inclusive unless set to zero, in which

            case only identities greater than zero (i.e. with at least one

            shared hash) will be reported. Set to -1 to output everything.

            (-1-1) [0]


  -v <num>  Maximum p-value to report. (0-1) [1.0]


mash info

$ mash info


Version: 2.3


Usage:


  mash info [options] <sketch>


Description:


  Display information about sketch files.


Options:


  Option  Description (range) [default]


  -h      Help


  -H      Only show header info. Do not list each sketch. Incompatible with -d,

          -t and -c.


  -t      Tabular output (rather than padded), with no header. Incompatible with

          -d, -H and -c.


  -c      Show hash count histograms for each sketch. Incompatible with -d, -H

          and -t.


  -d      Dump sketches in JSON format. Incompatible with -H, -t, and -c.


追記

dockerイメージ

https://hub.docker.com/r/staphb/mash/


ラン

テストデータをダウンロードする。

wget https://gembox.cbcb.umd.edu/mash/genome1.fna 
wget https://gembox.cbcb.umd.edu/mash/genome2.fna
wget https://gembox.cbcb.umd.edu/mash/genome3.fna


例1

disコマンドを走らせればすぐに2配列を比較できる。

mash dist genome1.fna genome2.fna

解析が終わると、STDOUTにReference-ID、Query-ID、Mash-distance、P-value、Matching-hashesが出力される。

genome1.fna  genome2.fna  0.0222766  0  456/1000


例2

結果は例1と同じだが、最初にsketchを走らせてsketcchファイルを作ることで、繰り返し時のランタイムを短縮する。

mash sketch genome1.fna 
mash sketch genome2.fna

sketchコマンドを実行するとgenome1.fna.msh、genome2.fna.mshというk-mer indexのバイナリファイルができる。中身はinfoコマンドで確認できる。

mash info genome1.fna.msh

 mash info genome1.fna.msh 

Header:

  Hash function (seed):          MurmurHash3_x64_128 (42)

  K-mer size:                    21 (64-bit hashes)

  Alphabet:                      ACGT (canonical)

  Target min-hashes per sketch:  1000

  Sketches:                      1


Sketches:

  [Hashes]  [Length]  [ID]         [Comment]


  1000      4639675   genome1.fna  -


distコマンドの引数に.mshファイルを指定してランする。 

mash dist genome1.fna.msh genome2.fna.msh


例3

genome3をgenome1、2と比較する。はじめにgenome1とgenome2のsketchを実行し、できた.mshファイルをgenome3と比較する。

mash sketch -o reference genome1.fna genome2.fna
mash info reference.msh
mash dist reference.msh genome3.fna

genome1.fna genome3.fna 0 0 1000/1000

genome2.fna genome3.fna 0.0222766 0 456/1000


例4

例1のように、distコマンドで1-3を比較するとgenome1とgenome2、genome1とgenome3の比較になる(例3との違いを確認する)。

mash dist genome1.fna genome2.fna genome3.fna

genome1.fna genome2.fna 0.0222766 0 456/1000

genome1.fna genome3.fna 0 0 1000/1000


例5

RefSeqのデータベースと比較する。著者があらかじめ.mshファイルを準備してくれているので、これをダウンロードする。

#chromosome
wget https://gembox.cbcb.umd.edu/mash/refseq.genomes.k21s1000.msh
#plasmid
wget https://gembox.cbcb.umd.edu/mash/refseq.plasmid.k21s1000.msh


 ペアエンドシーケンスデータはコンカテネートしておく。gzに圧縮してもO.K。

cat pair*fq > merge.fq

NGSのデータを使う時は、低頻度k-merを除外するオプションを指定する。-m 2なら頻度2以上のk-merのみ利用される。

mash sketch -m 2 -p 4 merge.fq
  • -m    Minimum copies of each k-mer required to pass noise filter for reads. Implies -r. [1]
  • -p     Parallelism. This many threads will be spawned for processing. [1]

 Refseqのデータベースを指定してdistコマンドを走らせる。

mash dist refseq.genomes.k21.s1000.msh merge.fq.msh > distances.tab

sortしてtop10ヒットを確認する。

sort -gk3 distances.tab | head


例6

コンタミが予想される時は、screenコマンドを使う。sketchでlow k-merを捨てず、fastqをそのままscreenの引数に指定する。

mash screen refseq.genomes.k21s1000.msh ERR024951.fastq > screen.tab
sort -gr screen.tab | head

トップヒットに特定の種の様々な株ばかりヒットしてくる場合、winner take all戦略のフラグ(-w)を立てることで回避できる。

mash screen -w -p 4 refseq.genomes.k21s1000.msh ERR024951.fastq > screen.tab 
sort -gr screen.tab | head
  • -w   Winner-takes-all strategy for identity estimates. After counting hashes for each query, hashes that appear in multiple queries will be removed from all except the one with the best identity (ties broken by larger query), and other identities will be reduced. This removes output redundancy, providing a rough compositional outline.  


例7

例えばメタゲノムのアセンブリなどの multi-fastaを比較する。はじめにfastaを分割する(FASTAの分割)。

#ヘッダー数を調べる
grep
-n ">" metagenome_assembly.fasta |wc -l
3621と出たとする。

#ヘッダ数で分割。
partition.sh in=metagenome_assembly.fasta out=contig%.fasta ways=3621

MASHで計算する。論文中(MethodsのMetagenomic clustering)では以下のパラメータが使用されている。 ワイルドカードを使ってFASTAを指定している。

mash sketch -s 400 -k 16 -o out contig*.fasta
  • -s     Sketch size. Each sketch will have at most this many non-redundant              min-hashes. [1000]
  • -k     K-mer size. Hashes will be based on strings of this many              nucleotides. Canonical nucleotides are used by default (see              Alphabet options below). (1-32) [21]
  • -o     Output prefix (first input file used if unspecified). The suffix '.msh' will be appended.

 out.mshファイルが1つできるので、これを全FASTAファイルと比較する。

 mash dist -p 10 out.msh *fasta > result

1行ずつ 全結果が出力されるので、行列に変換して例えばヒートマップ等で可視化する。


MASHのパラメータ例

kmer-dbのsupplementary data 

引用

Mash: fast genome and metagenome distance estimation using MinHash

Brian D. Ondov, Todd J. Treangen, Páll Melsted, Adam B. Mallonee, Nicholas H. Bergman, Sergey Koren, and Adam M. Phillippy

Genome Biol. 2016; 17: 132.


MinHashを使いfasta / fastqから生物種を高速推定する BBSketch

2019 6/13 追記

2019 7/18 インストール追記

2020 7/7 コマンド追記、help 更新

2020 7/9 文章追記


以前このブログで紹介したBBtoolsに、Minhashアルゴリズムリンク)を使ってわずか数秒でゲノムなどの大きな配列を比較し、トップヒットを返してくれる機能が実装されている。Biostarsに使い方が載せてあったので、紹介しておきます。


MinHash Sketchは、大きな文字列や集合を素早く比較する方法である。ゲノミクスでは、次のような使い方ができる。

1) ゲノム内のすべてのkmerを集める。

2) それらにハッシュ関数を適用する。

3) 10000個の最小のハッシュコードを保持し、このセットを「スケッチ」と呼ぶ。

これを複数のゲノムに対して行うと、2つのゲノムがどれだけ似ているかをアラインメントを介して計算するよりもはるかに速く計算できる。例えば、何かをアセンブルした場合、それをスケッチして、数秒でntやRefSeqにあるすべてのもののスケッチと比較することができる。トップヒットしたスケッチが、そのハッシュコードの90%を大腸菌と共有していることを示している場合、それは大腸菌とほぼ90%のkmer同一性を持っていることを意味し、したがって大腸菌であることを意味する。

sendsketch.sh in=contigs.fa
これはアセンブリのスケッチを作成し、JGIのtaxonomyサーバへのHTTP接続を開き、スケッチを送信する。サーバはそれをすべてのntのスケッチと比較し、トップヒットを返す。


BBtools

https://jgi.doe.gov/data-and-tools/bbtools/bb-tools-user-guide/

NGSでのMinHashの活用例(MASH)

http://mash.readthedocs.io/en/latest/distances.html


インストール

BBtoolsはbrewで導入できる。

#bioconda
mamba install -c bioconda bbmap -y

#homebrew
brew install BBtools


バージョンが古いと機能自体がないかもしれない。また、サーバーのアップデートに伴い、バージョンアップを要求される場合がある。

upgradeする。

#bioconda
mamba update bbmap

#homebrew
brew upgrade BBtools

sendsketch.sh


Written by Brian Bushnell

Last modified December 19, 2019


Description:  Compares query sketches to reference sketches hosted on a 

remote server via the Internet.  The input can be sketches made by sketch.sh,

or fasta/fastq files from which SendSketch will generate sketches.  

Only sketches will sent, not sequences.


Please read bbmap/docs/guides/BBSketchGuide.txt for more information.


Usage:  

sendsketch.sh in=file


To change nucleotide servers, add the server name, e.g.:

sendsketch.sh in=file nt


For the protein server with nucleotide input:

sendsketch.sh in=file protein


for the protein server with amino input:

sendsketch.sh in=file amino protein


Standard parameters:

in=<file>       Sketch or fasta file to compare.

out=stdout      Comparison output.  Can be set to a file instead.

outsketch=      Optional, to write the sketch to a file.

local=f         For local files, have the server load the sketches.

                Allows use of whitelists; recommended for Silva.

                Local can only be used when the client and server access 

                the same filesystem - e.g., Genepool and Cori.

address=        Address of remote server.  Default address:

                https://refseq-sketch.jgi-psf.org/sketch

                You can also specify these abbreviations:

                   nt:      nt server

                   refseq:  Refseq server

                   silva:   Silva server

                   protein: RefSeq prokaryotic amino acid sketches

                   img:     IMG server (Not Yet Available)

                   mito:    RefSeq mitochondrial server (NYA)

                   fungi:   RefSeq fungi sketches (NYA)

                Using an abbreviation automatically sets the address, 

                the blacklist, and k.

aws=f           Set aws=t to use the aws servers instead of NERSC.

                When, for example, NERSC (or the whole SF Bay area) is down.


Sketch-making parameters:

mode=single     Possible modes, for fasta input:

                   single: Generate one sketch per file.

                   sequence: Generate one sketch per sequence.

k=31            Kmer length, 1-32.  This is automatic and does not need to

                be set for JGI servers, only for locally-hosted servers.

samplerate=1    Set to a lower value to sample a fraction of input reads.

                For raw reads (rather than an assembly), 1-3x coverage

                gives best results, by reducing error kmers.  Somewhat

                higher is better for high-error-rate data like PacBio.

minkeycount=1   Ignore kmers that occur fewer times than this.  Values

                over 1 can be used with raw reads to avoid error kmers.

minprob=0.0001  Ignore kmers below this probability of correctness.

minqual=0       Ignore kmers spanning bases below this quality.

entropy=0.66    Ignore sequence with entropy below this value.

merge=f         Merge paired reads prior to sketching.

amino=f         Use amino acid mode.  Input should be amino acids.

translate=f     Call genes and translate to proteins.  Input should be

                nucleotides.  Designed for prokaryotes.

sixframes=f     Translate all 6 frames instead of predicting genes.

ssu=t           Scan for and retain full-length SSU sequence.

printssusequence=f  Print the query SSU sequence (JSON mode only).

refid=          Instead of a query file, specify a reference sketch by name

                or taxid; e.g. refid=h.sapiens or refid=9606.


Size parameters:

size=10000      Desired size of sketches (if not using autosize).

mgf=0.01        (maxfraction) Max fraction of genomic kmers to use.

minsize=100     Do not generate sketches for genomes smaller than this.

autosize=t      Use flexible sizing instead of fixed-length.  This is

                nonlinear; a human sketch is only ~6x a bacterial sketch.

sizemult=1      Multiply the autosized size of sketches by this factor.

                Normally a bacterial-size genome will get a sketch size

                of around 10000; if autosizefactor=2, it would be ~20000.

density=        If this flag is set (to a number between 0 and 1),

                autosize and sizemult are ignored, and this fraction of

                genomic kmers are used.  For example, at density=0.001,

                a 4.5Mbp bacteria will get a 4500-kmer sketch.

sketchheapfactor=4  If minkeycount>1, temporarily track this many kmers until

                counts are known and low-count kmers are discarded.


Taxonomy and filtering parameters:

level=2         Only report the best record per taxa at this level.

                Either level names or numbers may be used.

                    0: disabled

                    1: subspecies

                    2: species

                    3: genus

                   ...etc

include=        Restrict output to organisms in these clades.

                May be a comma-delimited list of names or NCBI TaxIDs.

includelevel=0  Promote the include list to this taxonomic level.

                For example, include=h.sapiens includelevel=phylum

                would only include organisms in the same phylum as human.

includestring=  Only report records whose name contains this string.

exclude=        Ignore organisms in these clades.

                May be a comma-delimited list of names or NCBI TaxIDs.

excludelevel=0  Promote the exclude list to this taxonomic level.

                For example, exclude=h.sapiens excludelevel=phylum

                would exclude all organisms in the same phylum as human.

excludestring=  Do not records whose name contains this string.

banunclassified=f   Ignore organisms descending from nodes like 

                    'unclassified Bacteria'

banvirus=f      Ignore viruses.

requiressu=f    Ignore records without SSUs.

minrefsize=0    Ignore ref sketches smaller than this (unique kmers).

minrefsizebases=0   Ignore ref sketches smaller than this (total base pairs).


Output format:

format=2        2: Default format with, per query, one query header line;

                   one column header line; and one reference line per hit.

                3: One line per hit, with columns query, reference, ANI,

                   and sizeRatio.

                4: JSON (format=json also works).

                5: Constellation (format=constellation also works).

usetaxidname=f  For format 3, print the taxID in the name column.

usetaxname      for format 3, print the taxonomic name in the name column.

useimgname      For format 3, print the img ID in the name column.

d3=f            Output in JSON format, with a tree for visualization.


Output columns (for format=2):

printall=f      Enable all output columns.

printani=t      (ani) Print average nucleotide identity estimate.

completeness=t  Genome completeness estimate.

score=f         Score (used for sorting the output).

printmatches=t  Number of kmer matches to reference.

printlength=f   Number of kmers compared.

printtaxid=t    NCBI taxID.

printimg=f      IMG identifier (only for IMG data).

printgbases=f   Number of genomic bases.

printgkmers=f   Number of genomic kmers.

printgsize=t    Estimated number of unique genomic kmers.

printgseqs=t    Number of sequences (scaffolds/reads).

printtaxname=t  Name associated with this taxID.

printname0=f    (pn0) Original seqeuence name.

printqfname=t   Query filename.

printrfname=f   Reference filename.

printtaxa=f     Full taxonomy of each record.

printcontam=t   Print contamination estimate, and factor contaminant kmers

                into calculations.  Kmers are considered contaminant if

                present in some ref sketch but not the current one.

printunique=t   Number of matches unique to this reference.

printunique2=f  Number of matches unique to this reference's taxa.

printunique3=f  Number of query kmers unique to this reference's taxa,

                regardless of whether they are in this reference sketch.

printnohit=f    Number of kmers that don't hit anything.

printrefhits=f  Average number of ref sketches hit by shared kmers.

printgc=f       GC content.

printucontam=f  Contam hits that hit exactly one reference sketch.

printcontam2=f  Print contamination estimate using only kmer hits

                to unrelated taxa.

contamlevel=species Taxonomic level to use for contam2/unique2/unique3.

NOTE: unique2/unique3/contam2/refhits require an index.


printdepth=f    (depth) Print average depth of sketch kmers; intended

                for shotgun read input.

printdepth2=f   (depth2) Print depth compensating for genomic repeats.

                Requires reference sketches to be generated with depth.

actualdepth=t   If this is false, the raw average count is printed.

                If true, the raw average (observed depth) is converted 

                to estimated actual depth (including uncovered areas).

printvolume=f   (volume) Product of average depth and matches.

printca=f       Print common ancestor, if query taxID is known.

printcal=f      Print common ancestor tax level, if query taxID is known.

recordsperlevel=0   If query TaxID is known, and this is positive, print at

                    most this many records per common ancestor level.


Sorting:

sortbyscore=t   Default sort order is by score.

sortbydepth=f   Include depth as a factor in sort order.

sortbydepth2=f  Include depth2 as a factor in sort order.

sortbyvolume=f  Include volume as a factor in sort order.

sortbykid=f     Sort strictly by KID.

sortbyani=f     Sort strictly by ANI/AAI/WKID.

sortbyhits=f    Sort strictly by the number of kmer hits.


Other output parameters:

minhits=3       (hits) Only report records with at least this many hits.

minani=0        (ani) Only report records with at least this ANI (0-1).

minwkid=0.0001  (wkid) Only report records with at least this WKID (0-1).

anifromwkid=t   Calculate ani from wkid.  If false, use kid.

minbases=0      Ignore ref sketches of sequences shortert than this.

minsizeratio=0  Don't compare sketches if the smaller genome is less than

                this fraction of the size of the larger.

records=20      Report at most this many best-matching records.

color=family    Color records at the family level.  color=f will disable.

                Colors work in most terminals but may cause odd characters

                to appear in text editors.  So, color defaults to f if 

                writing to a file.

intersect=f     Print sketch intersections.  delta=f is suggested.


Metadata parameters (optional, for the query sketch header):

taxid=-1        Set the NCBI taxid.

imgid=-1        Set the IMG id.

spid=-1         Set the sequencing project id (JGI-specific).

name=           Set the name (taxname).

name0=          Set name0 (normally the first sequence header).

fname=          Set fname (normally the file name).

meta_=          Set an arbitrary metadata field.

                For example, meta_Month=March.


Other parameters:

requiredmeta=   (rmeta) Required optional metadata values.  For example:

                rmeta=subunit:ssu,source:silva

bannedmeta=     (bmeta) Forbidden optional metadata values.


Java Parameters:

-Xmx            This will set Java's memory usage, overriding autodetection.

                -Xmx20g will specify 20 gigs of RAM, and -Xmx200m will specify 200 megs.

                    The max is typically 85% of physical memory.

-eoom           This flag will cause the process to exit if an out-of-memory

                exception occurs.  Requires Java 8u92+.

-da             Disable assertions.


For more detailed information, please read /bbmap/docs/guides/BBSketchGuide.txt.

Please contact Brian Bushnell at bbushnell@lbl.gov if you encounter any problems.


ラン

データベースに問い合わせるので、コマンド実行時はネットに繋がっている必要がある。


de novoアセンブリして得たFASTAをJGIのtaxonomy serverに問い合わせ、top hitを返す。

sendsketch.sh in=contigs.fa


Schizosaccharomyces_pombeのゲノムを指定してみる。

sendsketch.sh in=contigs.fa

sketchファイルで結果は問い合わされ、 数秒で結果が返ってくる。

$ sendsketch.sh in=Schizosaccharomyces_pombe.ASM294v2_chr1.fa 

Max memory cannot be determined.  Attempting to use 3200 MB.

If this fails, please add the -Xmx flag (e.g. -Xmx24g) to your command, 

or run this program qsubbed or from a qlogin session on Genepool, or set ulimit to an appropriate value.

Adding /usr/local/Cellar/bbtools/37.77/resources/blacklist_refseq_species_300.sketch to blacklist.

Loaded 1 sketch in 0.897 seconds.


Query: Schizosaccharomyces_pombe.ASM294v2_chr1.fa DB: RefSeq SketchLen: 11783 Seqs: 1 Bases: 5579033 gSize: 5438526

WKID KID ANI Complt Contam Matches Unique noHit TaxID gSize gSeqs taxName

100.00% 44.56% 100.00% 44.56% 0.00% 6890 6876 0 4896 12075791 5 Schizosaccharomyces pombe

  • KID (or kmer identity) is simply the percent of the kmers that matched
  • WKID is the weighted kmer identity, which has been adjusted to compensate for genome size.
  • matches is the number of matching kmers between the query and reference sketch

マッチしたk-merの数やゲノムサイズで正規化した割合のほか、ANIも出力される。RefseqのS.pombeのゲノムと100%合致した。複数見つかると、この例(リンク)のように出力される。プロテインの検索ならamino=tをつける。


NGSデータも高速に分析できる。例えばilluminaシーケンスデータ(fastq)の先頭100,000リードを分析する。

sendsketch.sh in=reads.fq reads=100k

10万リードなら実行後5秒ほどで結果が返ってくる。


生のPacBioはエラー率が高いので、感度を上げるためにデフォルトのスケッチサイズを大きくする。

sendsketch.sh in=pacbio_reads.fq reads=400k


genusレベルで結果を出力

sendsketch.sh level=3 in=HTS_reads.fq
  • level=2    Only report the best record per taxa at this level. Either level names or numbers may be used.
    0: disabled
    1: subspecies
    2: species
    3: genus
    ...etc


 データベースをSILVAに変える。 種レベルで問い合わせる。

sendsketch.sh in=16Samplicon.fastq level=3 address=silva
  • address=        Address of remote server.  Default address is sketch. You can also specify these abbreviations:
                       nt:      nt server
                       refseq:  Refseq server
                       silva:   Silva server
                       protein: RefSeq prokaryotic amino acid sketches
                       img:     IMG server (Not Yet Available)
                       mito:    RefSeq mitochondrial server (NYA)
                       fungi:   RefSeq fungi sketches (NYA)


データベースをproteinに変える。属レベルで問い合わせる。

sendsketch.sh in=proteins.faa level=2 address=protein
  • address=        Address of remote server.  Default address is sketch. You can also


ロングリードのfastqを指定してエラーが出る場合

=> fastaに変換してから読み込む。

seqkit fq2fa ONT.fq > ONT.fa
sendsketch.sh in=HONT.fa reads=100k


目的によってはblastの置き換えになるツールです。コンタミネーションの簡易チェックにも使えると思います。ぜひ導入して使ってみてください。


追記

bamやsamでも動作します。


引用

Tool: BBSketch - A Tool for Rapid Sequence Comparison

BBSketch - A Tool for Rapid Sequence Comparison


クラスタを自動で決めてビニングする BinSanity

2019 4/25 誤字修正

2019 7/6 インストール追記


 微生物の生態学に関する研究は、微生物の単離と培養が困難であることによるボトルネックを経験することが普通である(論文より Staley&Konopka、1985)。実験室環境でほとんどの生物を培養することの困難さのために、代替方法を使ってコミュニティ構造および推定上の機能性を解明することが一般に行われている。そのような方法の1つは、環境中のすべての微生物の集団ゲノム(メタゲノミクス)の配列決定である(Handelsman et al、1998)。メタゲノミクスは、ゲノムの可能性を解明し、経路、代謝および分類学に関する情報を提供し、培養せずに環境の状況に関する推論を可能にする(Meyer et al、2016)。Metagenome-assembled genomes (MAG)にcontigを分類することは、メタゲノムデータを分析する際に直面するハードルの1つである。典型的には、現在のビニングプロトコルでは、サイズ閾値以下のコンティグに対する精度の低下、クラスターの識別におけるヒトの介入の必要性、関連微生物の差別化、または低カバレッジおよび低アベイラビリティ生物の排除を含むいくつかの問題の1つに遭遇する2014; Bowers et al、2015; Imelfort et al、2014)。

 一般的なunsupervisedのビニング法では、関連する配列の推定上のグループ(ビン)を取ってくるために、例えばテトラヌクレオチド頻度(Anantharaman、Breier&Dick、2016; Pride et al、2003; Tully&Heidelberg、2016; Tully et al、2014)を使用したりする。codon usage (Chen et al。、2004; Kanayaら、1999)やGC含量(Bohlin et al、2010; Chen et al、2004)および短いオリゴヌクレオチド(k-mer )(Sandberg et al、2001; Zhou、Olman&Xu、2008)などののtaxon特異的な性質があるため、これらのフィンガープリントはコンティグの特徴付けおよびクラスター化に用いられてきた。しかしながら、composition単独の利用では、いくつかの理由でビニングプロセス中に偏りをもたらす可能性がある。これには例えば類似のフィンガープリントを有する密接に関連する種、および/または現実を表さないキメラビンを作製してしまう水平移動によって取得された遺伝子などがあげられる(Dick et al、2009)。ビニング中の追加変数としてカバレッジ情報を組み込むことによって、いくつかの方法およびプロトコルが成功した(Alneberg et al、2014; Imelfort et al、2014; Kang et al、2015; Lu et al、2016; Wu et al、2014)。新しいビニングプロトコルの開発は、複雑な環境コミュニティを特徴づけ、現在では達成できない培養ベースの研究レベルでの微生物多様性を調べるために不可欠である。

 BinSanityはクラスタリングアルゴリズムAffinity Propagation (AP)を使用し、コンティグカバレッジを主要な区切り要素として取り入れている。他のクラスタリングアルゴリズムは、compositionデータおよびカバレッジデータを使用して関連するDNAフラグメントを効果的にグループ化することができるが、階層的およびk-meansクラスタリングのような一般的な方法は、最終的なクラスタ数(例えばベイジアン情報基準)を人間が指定する必要がある。複雑な生態系では、コミュニティの多様性のために先験的な数値を割り当てることがますます困難になっている。対照的に、APはクラスター数を決定するにあたり入力を必要としない。代わりに、すべての点が潜在的クラスター中心として反復的に考慮される。データは、APがさまざまな種類のデータを同様のクラスタリング方法(Chen-Chia et al、2015; Flynn&Moneypenny、2013; Frey&Dueck、2007; Fujiwara et al、2015; Gan 2014; Leon、Sumedha&Weigt、2007; Walter、Fischer&Buhmann、2007; Zhengdong&Carreira-Perpinan、2008)と同等に効果的にクラスタリングすることを示しており、時にはより精度の高いことが多い。以前にもクラスタリングコンティグのためAPが実装されていたが(Lin&Liao、2016)、クラスター化の主要な方法としてsingle copy marker genesおよびテトラヌクレオチド頻度を含んでいた。対照的に、BinSanityは、カバレッジを使用して決定されたクラスタの初期セットを作成することによって、コンティグをビニングするための可能性のある合成ベースのバイアスをバイパスする(一部略)。

 BinSanityを現在公開されている5種類のビニングソフトウェアツールと比較してベンチマークした。著者らは、いくつかの人工の微生物コニュニティを構築し、これらの配列に基づいてin silicoメタゲノムサンプルを作成した。コミュニティは、組成に基づくビニングアルゴリズム、特にclosely relatedな低存在度の生物からなるメタゲノムに関して問題となる可能性のある配列で構成されていた。さらに、著者らはinfant gut microbiome time-series のデータセットを使い、最初にemergent self-organizing maps(ESOM)(Dick et al、2009)を用いて構築された高度にキュレーションされたゲノムビンのセットと比較してBinSanityを介して生成されたクラスターがどうなっているか調べた 。調査の結果、BinSanityは、自動化されたプロセスを介してメタゲノミクスデータセットから高品質のゲノムを生成することができ、複雑な微生物群集を理解する能力が向上することがわかった。


f:id:kazumaxneo:20180508213200j:plain

図1ワークフロー。論文より転載。 


マニュアル

https://github.com/edgraham/BinSanity/wiki/Usage


インストール

mac osx 10.13とubuntu16.0.4のminiconda2.4.0.5環境に導入した。

依存

リンク先の指示に従い導入する。公式マニュアル(リンク)も参照してください。 


本体 Github

https://github.com/edgraham/BinSanity

sudo pip install BinSanity

#scikit-learnが入らなかったので別途導入
pip install -U scikit-learn

Binsanity

$ Binsanity

usage: Binsanity -f [/path/to/fasta] -l [fastafile] -c [coverage file]


    *****************************************************************************

    *********************************BinSanity***********************************

    **  Binsanity uses Affinity Propagation to split metagenomic contigs into  **

    **  'bins' using contig coverage values. It takes as input a coverage file **

    **  and files containing the contigs to be binned, then outputs clusters   **

    **  of contigs in putative bins.                                           **

    **                                                                         **

    **  NOTE: BinSanity becomes highly memory intensive at 100,000 contigs or  **

    **  above. If you have greater than this number of contigs we recommend    **  

    **  trying the beta-version for our script binsanity-lc.                   **

    *****************************************************************************


optional arguments:

  -h, --help           show this help message and exit

  -c INPUTCOVFILE      Specify a Coverage File


  -f INPUTCONTIGFILES  Specify directory 

                           containing your contigs


  -p PREFERENCE        

                           Specify a preference (default is -3) 


                           Note: decreasing the preference leads to more lumping, 

                           increasing will lead to more splitting. If your range 

                           of coverages are low you will want to decrease the preference,

                           if you have 10 or less replicates increasing the preference could 

                           benefit you.

  -m MAXITER           

                           Specify a max number of iterations [default is 2000]

  -v CONVITER          

                           Specify the convergence iteration number (default is 200)

                           e.g Number of iterations with no change in the number

                           of estimated clusters that stops the convergence.

  -d DAMP              

                           Specify a damping factor between 0.5 and 1, default is 0.9

  -l FASTAFILE         

                           Specify the fasta file containing contigs you want to cluster

  -x CONTIGSIZE        

                           Specify the contig size cut-off [Default 1000 bp]

  -o OUTPUTDIR         

                           Give a name to the directory BinSanity results will be output in 

                           [Default is 'BINSANITY-RESULTS']

  --outPrefix OUTNAME  

                           Sepcify what prefix you want appended to final Bins {optional}

  --log LOGFILE        

                           specify a name for the log file [Default is 'binsanity-logfile.txt']

  --version            show program's version number and exit

None


ラン

テストデータを走らせる。使うのは、Infant Gut Metagenome (pubmed)由来アセンブリデータ: igm.fa(FASTA。ファイル、35.9Mb)。bowtie2でマップングして、contig-coverage-bam.pyとcov-combine.pyでカバレッジを出しパースした結果:Infant_gut_assembly.cov.x100.lognormも準備されている。

ランする。

Binsanity -f . -l igm.fa -p -10 -c Infant_gut_assembly.cov.x100.lognorm 
  • -f    Specify directory containing your contigs
  • -l    Specify the fasta file containing contigs you want to cluster
  • -c   Specify a Coverage File
  • -p   Specify a preference (default is -3). Note: decreasing the preference leads to more lumping, increasing will lead to more splitting. If your range of coverages are low you will want to decrease the preference, if you have 10 or less replicates increasing the preference could benefit you.

結果はデフォルトでは”BINSANITY-RESULTS/”に出力される。

f:id:kazumaxneo:20180507164906j:plain


binningされたFASTAが出力されている。一番上はlogファイル。

f:id:kazumaxneo:20180507165057j:plain


 テスト

SRAのメタゲノムシーケンスデータを解析してみる。論文

Next generation sequencing data of a defined microbial mock community (pubmed)

 で公開されたシーケンスデータを使ってみる。注意深く選択されたメタゲノムのmock (擬似) communityのシーケンスデータの論文で、研究者がベンチマークしたり、新しい手法をテストする目的で構築されている。有機物に富む土壌メタゲノムほど複雑ではないが、論文によれば、Acidobacteria、Actinobacteria、Bacteroidetes、Deinococcus-Thermus、Firmicutes、Alpha-and Gamma-Proteobacteria、Spirochaetes、Thermotogae、VerrucomicrobiaおよびEuryarchaeotaに属する23の細菌および3つの古細菌株からなっていると書かれている。ゲノムサイズ1.8Mbpから6.5Mbp、GC含量28.4~72.7%、リピート含量は0~18.3%、全てゲノムが決定されている(論文 図1、表1)。シミュレーションではなく、実際に一定量の菌からDNAを抽出してディープシーケンスしている(illumina Hiseqとpacbio RSII)。シーケンスのデプスは種によって大きな差がある。(図2 DNA抽出効率の違いやシーケンスバイアス)。


論文のショートリードシーケンスデータ(リンク)とリングリードシーケンスデータ(リンク)をダウンロードしてfastqに変換する。Hiseqでディープシーケンスされていて、fastqのサイズは120GB超ある。

#ショートリード(illumina 31GB)
prefetch --option-file SRR_Acc_List.txt  --max-size 1000000000

#ペアエンドfastqに変換 (展開するとおよそ120GB)
fastq-dump SRR3656745.sra --split-files -O output_dir

#ロングリード(pacbio 100MB)
prefetch --option-file SRR_Acc_List2.txt  --max-size 1000000000
fastq-dump SRR3656745.sra -O output_dir

ショートリードのフルデータをde novo assmeblyするのは厳しいので、30%ランダムサンプリングしてアセンブルする。

seqkit sample -p 0.3 illumina/SRR3656745_1.fastq > SRR3656745_1_30per.fq

seqkit sample -p 0.3 illumina/SRR3656745_2.fastq > SRR3656745_2_30per.fq

#時間がかかるのでここではエラー訂正は実行しない。k-merも55だけとする。
metaspades.py -k 55 -t 40 --only-assembler -1 SRR3656745_1_30per.fq -2 SRR3656745_2_30per.fq -o outdir

#hybridアセンブリ
metaspades.py -k 55 -t 40 --only-assembler -1 SRR3656745_1_30per.fq -2 SRR3656745_2_30per.fq --pacbio SRR3656744.fastq -o outdir_hybrid

ここからはショートリードのアセンブリ結果で説明していく。

ヘッダーが複雑だと失敗するらしいので、アセンブリしたFASTAのヘッダーを連番にリネームする。公式ではsimplify-fasta というスクリプトを使っているが、ここではperlワンライナーで処理する(たぶんしなくても大丈夫。おまじない)。

perl -ane 'if(/\>/){$a++;print ">name_$a\n"}else{print;}' outdir/scaffolds.fasta > assembly_rename.fa

オリジナルデータをmappingしてbamを作る。bowite2でもよいが、遅いのでここではSTARを使う。

mkdir genome #出力用のディレクトリを作成

#index
STAR --runMode genomeGenerate --genomeDir genome/ --genomeFastaFiles assembly_rename.fa --runThreadN 20

#mapping
STAR --genomeDir genome/ --readFilesIn illumina/SRR3656745_1.fastq illumina/SRR3656745_2.fastq --runThreadN 20 --outSAMtype BAM SortedByCoordinate --outFileNamePrefix mapping

#bamディレクトリに移動してindexをつけておく。
mkdir bam
mv mappingAligned.sortedByCoord.out.bam bam/
samtools index bam/mappingAligned.sortedByCoord.out.bam

 Binsanity-profile を使ってカバレッジを計算する。Binsanity-profile はfeature countsを使い、bamの各コンティグのカバレッジを計算する。pipでBinsanityを導入していればBinsanity-profile コマンドもパスが通っている。もし通って無ければBinSanityのレポジトリをcloneして取ってくる。bin/に入っている。

#Binsanity-profileがパスが通ってなければ
git clone https://github.com/edgraham/BinSanity.git
cd BinSanity/bin/

./Binsanity-profile #ヘルプ

$ ./Binsanity-profile 

usage: Binsanity-profile -i fasta_file -s {sam,bam}_file --id contig_ids.txt -c output_file


    ***********************************************************************

    ******************************BinSanity********************************

    **                                                                   **

    **  Binsanity-profile is used to generate coverage files for         **

    **  input to BinSanity. This uses Featurecounts to generate a        **  

    **  a coverage profile and transforms data for input into Binsanity, **

    **  Binsanity-refine, and Binsanity-wf                               **

    **                                                                   **  

    ***********************************************************************

    ***********************************************************************


optional arguments:

  -h, --help            show this help message and exit

  -i INPUTFASTA         Specify fasta file being profiled

  -s INPUTMAPLOC        

                            identify location of BAM files

                            BAM files should be indexed and sorted

  --ids INPUTIDS        

                            Identify file containing contig ids

  -c OUTCOV             

                            Identify name of output file for coverage information

  --transform TRANSFORM


                            Indicate what type of data transformation you want in the final file [Default:log]:

                            scale --> Scaled by multiplying by 100 and log transforming

                            log --> Log transform

                            None --> Raw Coverage Values

                            X5 --> Multiplication by 5

                            X10 --> Multiplication by 10

                            X100 --> Multiplication by 100

                            SQR --> Square root

                            We recommend using a scaled log transformation for initial testing. 

                            Other transformations can be useful on a case by case basis

  -T THREADS            Specify Number of Threads For Feature Counts [Default: 1]

  -o OUTDIRECTORY       Specify directory for output files to be deposited [Default: Working Directory]

  --version             show program's version number and exit


カバレッジファイルを作成するにはcontigのidファイル(FASTAのヘッダーを抽出したもの)も必要になる。idファイル作成はutilsディレクトリの"get-ids"を使う。-xで最小サイズ(bp)を指定することで、小さすぎるコンティグは除外できる。

BinSanity/utils/get-ids -f . -l assembly_rename.fa -x 1000 -o contig_id

-fでFASTAディレクトリを指定している (ここではカレント指定)。

出力。このリストがカバレッジ分析対象になる。

$ head -n 5 contig_id 

name_1

name_2

name_3

name_4

name_5

 準備ができたら、Binsanity-profileでカバレッジリスト作成する。さきほど作成したcontig idファイルと、bamファイルのディレクトリを指定する(bowtie2などでマッピングしてsortしたbamを使う)。

Binsanity-profile -i assembly_rename.fa --ids contig_id --transform scale -s bam/ -c output
  • --transform scale   Scaled by multiplying by 100 and log transformed
  • -i        Specify fasta file being profiled
  • --ids  Identify file containing contig ids
  • -s       Identify location of BAM files BAM files should be indexed and sorted
  • -c       Identify name of output file for coverage information

 100xしてlog変換したカバレッジが出力される。

$ head output.cov.x100.lognorm 

name_2 1.17806802743

name_3 1.15201791709

name_1 1.13838011255

name_6 1.13774417222

name_7 1.15336912817

name_4 1.15184188719

name_5 1.15177317581

name_8 1.15638071781

name_9 1.15594755044

name_55 1.86927209439

最後にbinningを実行する。自動でクラスター数が決定され、binningが実行される。

Binsanity -f . -l assembly_rename.fa -p -10 -c output.cov.x100.lognorm

 出力。8つのクラスターが検出された。

f:id:kazumaxneo:20180508204623j:plain

この後、checkMなどのツールにかけて、コンタミネーション、完全度を推定する。

引用

BinSanity: unsupervised clustering of environmental microbial assemblies using coverage and affinity propagation.

Graham ED, Heidelberg JF, Tully BJ

PeerJ. 2017 Mar 8;5:e3035.


メタゲノムアセンブリ結果を可視化してマニュアルビニングを助ける gbtools


 ほとんどの環境微生物が難培養性であることを考えると、microbial ecologyの分野では、metagenomicsは全コミュニティの機能を調べる手段に由来していた(論文より Handelsman、2004; Kunin et al、2008; Teeling and Glockner、2012)。研究者は、微生物群全体からのDNAのショットガンシーケンシングを行い、得られたメタゲノムをコミュニティ全体の遺伝子プールからのサンプルとして扱い、それらの集合的機能潜在性の像を再構成するか、またはアセンブルして個々の微生物ゲノムを抽出する( "binning")。メタゲノムからのゲノムのビニングは、比較的低い多様性のサンプル(Tyson et al、2004; Woyke et al、2006)を用いて過去に行われてきたが、ハイスループットシークエンシングの最近の進歩により、より多様化したコミュニティから個々のゲノムを隔離することが現実的になった。

 ビニングの戦略は、(i)配列の内部統計的性質、例えばk-mer頻度(Teeling et al、2004)、(ii) (Kembel et al、2011)または全ヌクレオチドデータベース(Kumar et al、2013)、または(iii)異なる配列間のカバレッジ/カバレッジの生物学的または技術的変動(Albertsen et al、2013; Imelfort et al、2014; Nielsen et al、2014)、self-organizing maps(Dick et al、2009)、補間マルコフモデル(Strous et al、2012)、 expectation maximization(Wu et al、 2014)、およびk-medioids clustering(Kang et al。、2015)がある。いずれも多数のサンプルからの微生物ゲノムを自動的かつ高スループットでビニングすることを最終目的とする。

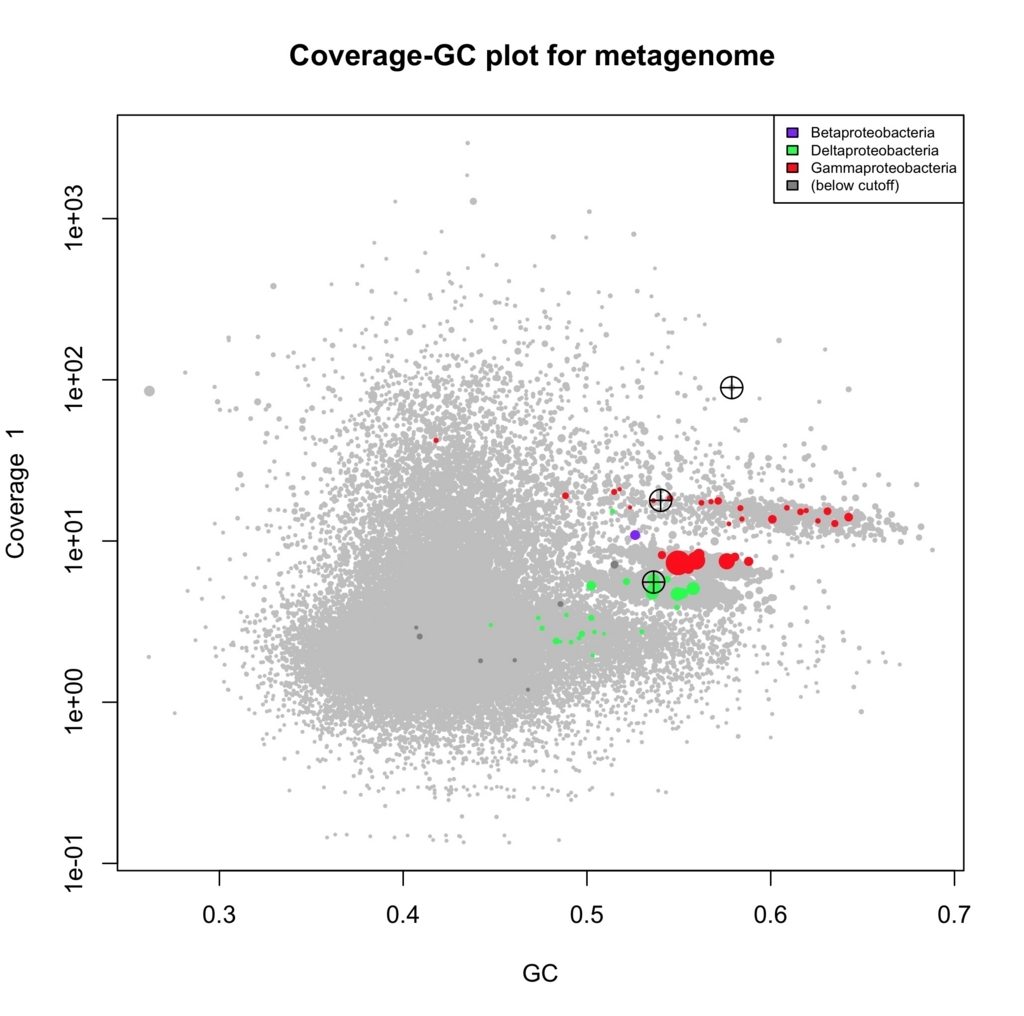
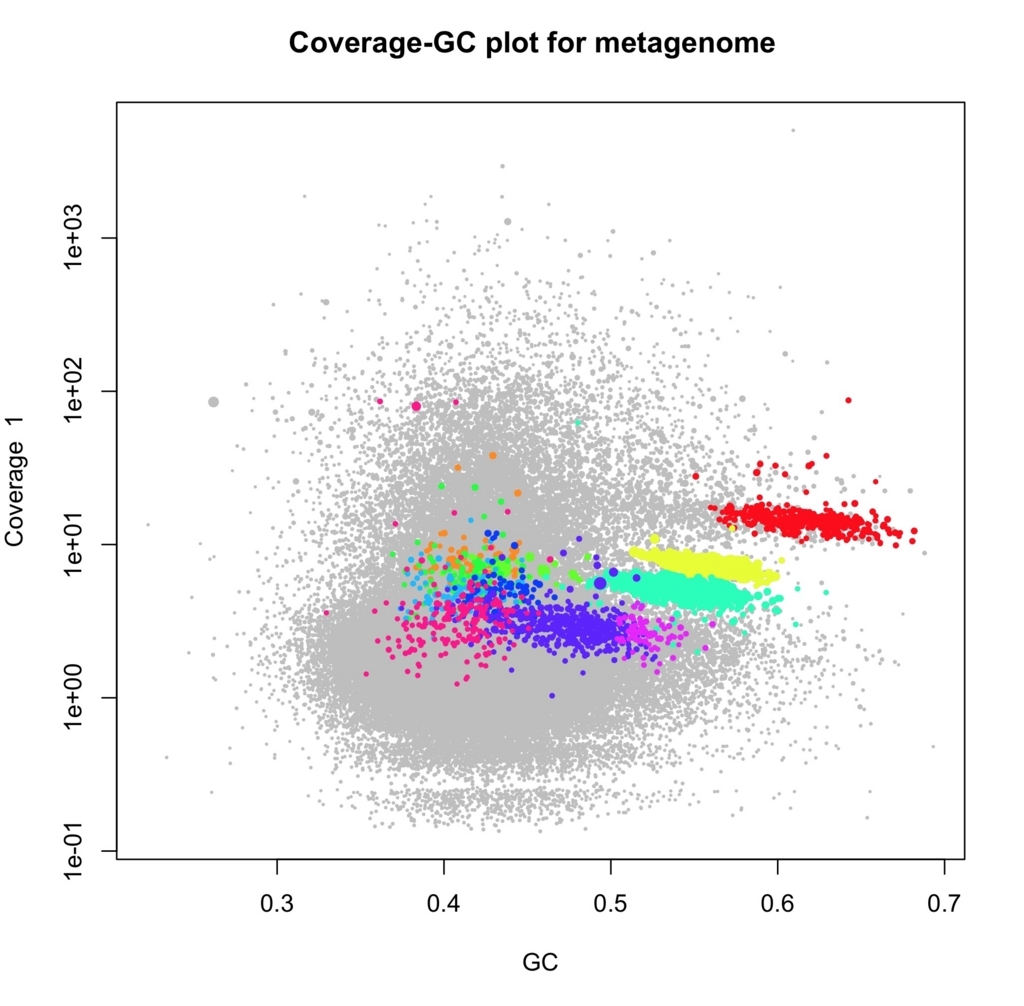
 ビジュアライゼーションは、通常、データ探査の第一歩であり、現在の多くの方法がunsupervisedのビニングに精通しているにもかかわらず、いまだメタゲノミクスツールキットの重要な部分となっている。host-symbiont systemsや微生物のコンソーシアムで発生するような、多様性の低い、カバレッジの高いサンプルでは、​​カバレッジGCプロットから手動でビンを定義することは可能かもしれない。リードのカバレッジを各コンティグのGC率に対してプロットする、または異なるライブラリ由来コンティグについてカバレッジ同士のプロットを行う。同じゲノムに由来するコンティグは、類似の配列組成(GC%で表される)および存在量(カバレッジで表される)を有すると予想されるので、これらのプロットにおいて一緒に集まるべきである。したがって、各クラスターは単一の推定ゲノムビンを表す。このようなヒューリスティックがAlbertsen et al(論文 紹介)によって用いられ、テトラヌクレオチド頻度の主成分分析およびプロット上に重ね合わされたマーカー遺伝子からのさらなる分類学的情報の助けを借りて、活性汚泥コミュニティから未培養バクテリアのほぼ完全なゲノム12個が抽出された。また、ビジュアライゼーションすることは、事後検証、不完全なビニングによる潜在的アーティファクトの発見、自動化された方法の検証やトラブルシューティングに役立つ。

 しかし、既存のビジュアライゼーションツールは、主に特定のビニング方法またはパイプラインに添付されている。したがって、その適用は比較的狭い(論文より 表1)。 Albertsen rt al(2013)はプロットと手作業によるビニングのためのスクリプト(統計コンピューティング言語Rで書かれている)を利用できるようにしたが、これらは新しいデータセットに対して大幅なカスタマイズが必要である。したがって、メタゲノムのビニングに関連するデータを統合し、エンドユーザが直感的な方法でデータの探索と可視化を実行できるようにするツールを提供することが著者らの動機だった。


マニュアル

https://github.com/kbseah/genome-bin-tools/wiki


インストール

mac osx 10.13に導入したが、一部ツールはcent osをつかった。

optional

Github

https://github.com/kbseah/genome-bin-tools

git clone https://github.com/kbseah/genome-bin-tools.git
cd /genome-bin-tools/R_source_package/
R #Rを立ち上げる
> install.packages("sp")
> install.packages("plyr")
> install.packages("gbtools_2.4.5.tar.gz",repos=NULL,type="source") #2.4.5の場合
> library(gbtools) #読み込み

> help(gbtools)

gbtools                package:gbtools                 R Documentation


Interactive visualization of metagenome assemblies in R


Description:


     gbtools lets you visualize metagenome assemblies by GC-coverage or

     differential coverage plots, and interactively bin them.


Details:


     See website for more details.


Author(s):


     Brandon Seah, <email: kbseah@mpi-bremen.de>


References:


     <URL: https://github.com/kbseah/genome-bin-tools>


ラン

step1 カバレッジ計算

ここではすでに全シーケンスデータを混ぜてde novoアセンブリを完了しているものとする。このメタゲノムのアセンブリツールに指定はない。

アセンブリで得たFASTAファイルを基に、BBtoolsを使いカバレッジを計算する。BBtoolsがなければ"brew install bbtools"でインストールしておく。

ライブラリAのカバレッジ計算。出力はSampleG1.covstatsとする。

bbmap.sh ref=assembly.fasta nodisk in1=sample1_f.fq.gz in2=sample1_r.fq.gz covstats=SampleG1.covstats

ライブラリBのカバレッジ計算。出力はSampleA2.covstatsとする。 

bbmap.sh ref=assembly.fasta nodisk in1=sample2_f.fq.gz in2=sample2_r.fq.gz covstats=SampleA2.covstats

ライブラリAとBは、例えば同じサンプルを異なる方法でDNA抽出したシーケンスデータ。AとBのシーケンスデータを両方使いde novoアセンブリを実行し、それを上記で使っている。

ランが終わると、カバレッジGC、lengthなどが出力される。

f:id:kazumaxneo:20180506090949j:plain

最近のバージョンのBBtoolsは、先頭行にコメントアウト"#"を使っているが、今回は邪魔になるので消しておく。右端にはMedian_foldとStd_Devのカラムがあるかもしれないが、この解析では使わない。


step2 マーカー遺伝子検出 (optional) 

AMPHORA2でマーカー遺伝子を検出する。AMPHORA2がなければgithubからcloneする。

#AMPHORA2のインストール
git clone https://github.com/martinwu/AMPHORA2.git
cd AMPHORA2/
sudo perl preinstall.pl #依存でないものが導入される。
export AMPHORA2_home=/home/foo/AMPHORA2
source ~/.bash_profile #またはbashrc
chmod +x /home/foo/AMPHORA2/Scripts/*

AMPHORA2が準備できたら、はじめにmarker protein配列を検出する。生物種が想定できなければ"-DNA"、限定するなら"-Bacteria"か"-Archaeal"をフラグに立てる。AMPHORA2/Marker/にデータベースがある。

cd AMPHORA2/Scripts/
mkdir output && cd output/
perl ../MarkerScanner.pl -DNA ~/data/metagenome_assrmbly.fasta

#各marker proteinのpepファイルが出力される。続いてmarker protein配列のアライメントを行い、マスクしてトリミングする。

perl ../MarkerAlignTrim.pl -WithReference -OutputFormat phylip

各marker proteinのalnと maskファイルが出力される。maker proteinの結果からphylotypeをアサインする。

perl ../Phylotyping.pl -CPUs 12 > phylotype.result

ここでgbtoolsに戻る。accessory_scripts/parse_phylotype_result.plを使い、Phylotyping.plの結果をパースする。

cd ~/genome-bin-tools/accessory_scripts/
perl parse_phylotype_result.pl -p phylotype.result > phylotype.result.parsed


step3、rRNA検出 (optional) 

phyloFlashのSSU rRNAデータベースを使い、rRNAを検出する。まずphyloFlashのデータベースを構築する。phyloFlashはBBtools、bowtie、barrnap(紹介)、vsearchを使う。なければbrewで導入しとく。"brew install bbtools vsearch barrnap bowtie"。

#phyloFlashのデータベース準備
wget https://github.com/HRGV/phyloFlash/archive/pf3.0b1.tar.gz
tar -xzf pf3.0b1.tar.gz
cd phyloFlash-pf3.0b1
./phyloFlash_makedb.pl --remote

 番号のディレクトリ(テスト時は132/)の中にSILVAのデータベースfastaができる。このファイルを指定して、gbtoolsのaccessory_scripts/get_ssu_for_genome_bin_tools.plを走らせる。

perl get_ssu_for_genome_bin_tools.pl -d phyloFlash-pf3.0b1/132/SILVA_SSU.noLSU.masked.trimmed.fasta -c 10 -a metagenome_assrmbly.fasta -o output

ssuRNAが検出されたcontigのリストファイル <output_prefix>.ssu.tabができる。これをgbtoolsに使用する。


step4、tRNA検出 (optional) 

tRNAscan-SEサーバーにアクセスする。

f:id:kazumaxneo:20180506140039j:plain

メタゲノムアセンブリFASTAを指定して、tRNA探索を実行する。解析は10分前後かかる。ラン後のテキストファイルをダウンロードする。ファイル名はtrna.tabとする。


optional step

 付属スクリプトでstep1-4のファイルのチェック(禁則文字がないか)

perl input_validator.pl --covstats FILE1,FILE2,FILE3 \ # Covstats files

                           --mark MARK1,MARK2 \ # Marker taxonomy files

                           --ssu SSU \ # SSU taxonomy file

                           --trna TRNA \ # tRNA gene prediction file

作業がやり直しになってしまうので、de novo アセンブリFASTAを得たら、すぐヘッダーをチェックしたほうがよいかもしれない。 


 step5、gbtoolsによるVisualizationとbinning

準備がおわったら、gbtoolsで結果を可視化する。ここからR内で作業する。

R #Rに入る。
> library(gbtools)
> library(sp)
> library(plyr)

ここではテストデータで手順を確認する。読み込むのはAlbertsen et alと同じ、2種類の抽出法でシーケンスされたというシーケンスデータになる。アセンブリしてstep1-4の分析が終わっている。


# SSU gene annotations

column -t example_data/Olavius_example/olavius_metagenome.ssu.tab |head

$ column -t example_data/Olavius_example/olavius_metagenome.ssu.tab |head

scaffold         SSUid                         SSUgenbankid     Superkingdom  Phylum          Class                Order                Family              Genus       Species      pid          alnlen      eval

contig-100_1055  contig-100_1055:1134-2950(+)  AF411870.1.1810  Eukaryota     Opisthokonta    Holozoa              Metazoa              Animalia            Annelida    Tubificidae  99.8         1809        -1

contig-100_1182  contig-100_1182:199-1249(+)   AF328856.1.1497  Bacteria      Proteobacteria  Gammaproteobacteria  Gammaproteobacteria  Incertae            Sedis       Unknown      Family       Arenicella  Olavius  algarvensis   sulfur-oxidizing  endosymbiont  99.9  1015  -1

contig-100_2324  contig-100_2324:1-1275(-)     AJ620497.1.1523  Bacteria      Proteobacteria  Deltaproteobacteria  Desulfobacterales    Desulfobacteraceae  uncultured  Olavius      algarvensis  Delta       4        endosymbiont  99.9              1269          -1


# Marker genes

column -t example_data/Olavius_example/amphora2_results.tab |head

$ column -t example_data/Olavius_example/amphora2_results.tab |head

scaffold          markerid             gene  Superkingdom  Phylum               Class                  Order                 Family                  Genus                  Species

contig-100_1020   contig-100_1020_29   dnaG  Bacteria      Proteobacteria       Deltaproteobacteria    Desulfobacterales     Desulfobacteraceae      Desulfobacterium       Desulfobacterium       autotrophicum

contig-100_505    contig-100_505_94    dnaG  Bacteria      Tenericutes          Mollicutes             Mycoplasmatales       Mycoplasmataceae        Mycoplasma             Mycoplasma             synoviae

contig-100_91717  contig-100_91717_10  dnaG  Bacteria      Fibrobacteres        Fibrobacteria          Fibrobacterales       Fibrobacteraceae        Fibrobacter            Fibrobacter            succinogenes

contig-100_328    contig-100_328_161   dnaG  Bacteria      Proteobacteria       Gammaproteobacteria    Legionellales         Coxiellaceae            Coxiella               Coxiella               burnetii

contig-100_3045   contig-100_3045_43   dnaG  Bacteria      Proteobacteria       Gammaproteobacteria    Chromatiales          Chromatiaceae           Allochromatium         Allochromatium         vinosum

contig-100_88109  contig-100_88109_5   dnaG  Bacteria      Spirochaetes         Spirochaetia           Spirochaetales        Spirochaetaceae         Spirochaeta            Spirochaeta            smaragdinae

contig-100_220    contig-100_220_33    dnaG  Bacteria      Proteobacteria       Deltaproteobacteria    Desulfobacterales     Desulfobacteraceae      Desulfococcus          Desulfococcus          oleovorans

contig-100_92     contig-100_92_330    frr   Bacteria      Proteobacteria       Gammaproteobacteria    Chromatiales          Halothiobacillaceae     Halothiobacillus       Halothiobacillus       neapolitanus

contig-100_91097  contig-100_91097_8   frr   Bacteria      Bacteroidetes        Bacteroidetes          Order                 II.                     Incertae               sedis                  Rhodothermaceae  Salinibacter  Salinibacter    ruber        (Salinibacter  ruber)

uesaka-no-Air-2:example_data kazumaxneo$ 


step1-4で得たファイルをインポートする。contigのカバレッジファイルは必須で、step2−4は任意。(詳細)。

> d <- gbt (covstats=c("SampleA2.covstats","SampleG1.covstats"),
ssu="olavius_metagenome.ssu.tab",
mark=c("amphora2_results.tab","blobology_results.tab"),
marksource=c("amphora2","blob"),
tRNA="trna.tab")

ssu = "SSU rRNA data"

mark = "Taxonomic marker data" (phylotype.result.parsed)

tRNA="tRNA data"


gbtのstats

> d #またはsummary (d)

> d

*** Object of class gbt ***


*** Scaffolds ***

      Total Scaffolds    Max Min Median  N50

1 107852810     92415 106400 500    884 1110


*** Marker counts by source ***

amphora2     blob 

     143     3072 


*** SSU markers ***

[1] 3


*** tRNA markers ***

[1] NA


*** User-supplied variables ***

[1] ""


*** Function call history ***

1

gbt.default(covstats = c("SampleA2.covstats", "SampleG1.covstats"), 

    mark = c("amphora2_results.tab", "blobology_results.tab"), 

    marksource = c("amphora2", "blob"), ssu = "olavius_metagenome.ssu.tab")


カバレッジGCのプロット。

plot (d, ssu=TRUE, textlabels=TRUE,legend=TRUE) 

f:id:kazumaxneo:20180506142612j:plain

taxonがアサインされたcontigは色が付いている(step2出力情報を使用)。


両軸カバレッジ(異なるライブラリ)。

plot (d, slice=c(1,2)) 

f:id:kazumaxneo:20180506142842j:plain


任意のクラスターをbinning。

plot (d,slice=1,marker=FALSE) # Turn off color overlays
d.bin1 <- choosebin (d, slice=1) # Click on the plot to define the region you want

グラフを直接クリックしてbinningを行う。

f:id:kazumaxneo:20180506143138j:plain

囲んだ領域を検出する。

summary(d.bin1) # Summarize the newly-created bin
points(d.bin1, slice=1) # Overlay the new bin on your plot

検出された。

f:id:kazumaxneo:20180506143507j:plain

binningされたクラスターを保存する。

write.gbtbin(d.bin1,file="list.txt") 

faSomeRecordsを使いFASTAに変換する。faSomeRecordsコマンドがなければkentutilsを導入する。

#kentutilsの導入。
git clone https://github.com/ENCODE-DCC/kentUtils.git
cd kentUtils/
./configure
make
cd bin/
#bin/にパスを通すなら(bash_profileの場合)
echo 'export PATH=$PATH:`pwd`' >> ~/.bash_profile && source ~/.bash_profile

 listファイルからFASTAに変換。

faSomeRecords original_assembly.fasta list.txt list.fasta 

lista.fastaが出力される。 

 BBtoolsを使い、binningされたcontigにマッピングされるリードを抽出する(outmにはペアリードの両方がアライメントされたものだけ出力される)。

bbmap.sh ref=shortlist.fasta outputunmapped=f outm1=mapped1.fq.gz outm2=mapped2.fq.gz in1=pair1.fq.gz in2=pair2.fq.gz 

 好みのアセンブリツールで再アセンブルする。

spades.py -k auto -t 20 --careful -1 mapped1.fq.gz -2 mapped2.fq.gz -o reassembly/


3-rd パーティのbinning結果を取り込むこともできる。ここではMetabatの結果を取り込む。

> head -n 5 Olavius_example/metabat_bins 

$ head -n 5 Olavius_example/metabat_bins 

bin09 contig-100_896

bin09 contig-100_3692

bin09 contig-100_3624

bin09 contig-100_3166

bin09 contig-100_3161


d.metabat_bins <- importBins (d, file="metabat_bins") 
multiBinPlot (d, bins=d.metabat_bins)

検出された。 

f:id:kazumaxneo:20180506143841j:plain

画像のパラメータ調整等についてはマニュアルを参照してください。

https://github.com/kbseah/genome-bin-tools/wiki

入力フォーマット

https://github.com/kbseah/genome-bin-tools/wiki/Appendix.-Input-file-formats


引用

gbtools: Interactive Visualization of Metagenome Bins in R.

Seah BK, Gruber-Vodicka HR

Front Microbiol. 2015 Dec 18;6:1451.